If you want to do meaningful retail analytics, you first need to understand what you're working with. Here's the map most aspiring analysts never get.
When most people think about "retail data," their mind jumps to sales numbers. Revenue went up. Revenue went down. Maybe a bar chart. Maybe a dashboard with some KPIs.
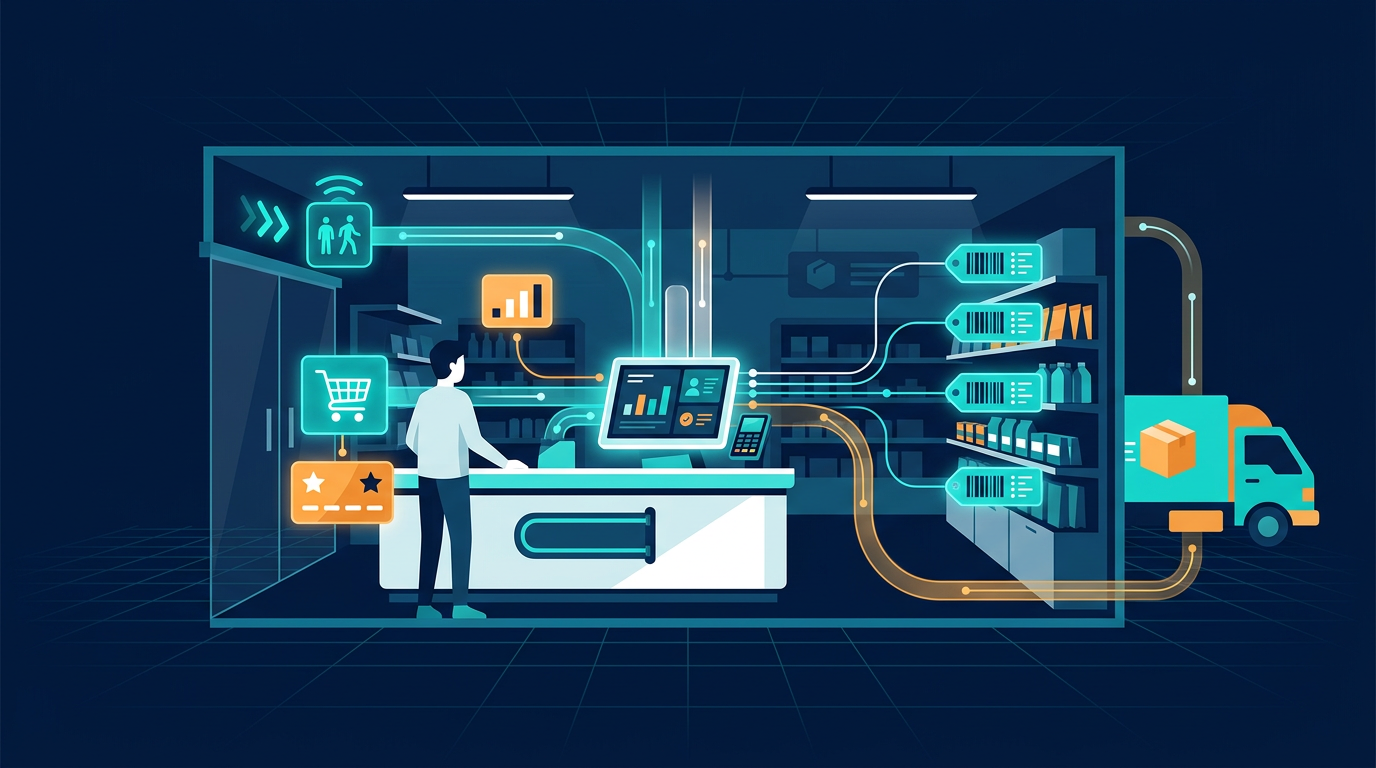
But here's the thing — a modern retail company doesn't just generate sales data. It generates an ecosystem of data. Every beep at the checkout counter, every loyalty card swipe, every shipment that rolls off a truck at 4 a.m., every camera counting heads at the entrance — all of it is data. And all of it connects to everything else in ways that most aspiring analysts never see until they're knee-deep in a real project and wondering why the numbers don't add up.
I've spent years working in consumer-facing industries, and the single biggest gap I see in early-career analysts is this: they don't know what data actually exists inside the companies they want to work for. They've learned SQL. They've practiced building models on Kaggle datasets. But nobody ever sat them down and said, "Here's what a retail company's data actually looks like, end to end."
So let's do that.
The Cash Register Is Just the Beginning: Point-of-Sale (POS) Data
The heartbeat of any retail operation is its POS system. Every time a customer checks out — whether at a physical register or through an e-commerce cart — a transaction record is created.
But a POS transaction isn't just "Customer bought shoes for $89." It's far richer than that. A single transaction captures the store location, the register ID, a timestamp down to the second, every individual SKU in the basket, the quantity of each item, the unit price, any discounts or promotions applied, the payment method, and often the associate who handled the sale. Multiply that by thousands of transactions per day across hundreds of stores, and you start to see the scale we're talking about.
This is the dataset that powers your sales reporting, your basket analysis, your revenue forecasting, and your promotional effectiveness studies. If you're an analyst walking into a retail company on day one, the POS data is your home base. Learn its schema. Understand its quirks. Every other dataset you touch will eventually get joined back to it.
The Identity Layer: Loyalty Programs and CRM Data
POS data tells you what was bought. Loyalty and CRM data tell you who bought it — and that changes everything.
When a customer enrolls in a loyalty program, the company starts building a profile. Name, email, phone number, maybe a home address. But the real value isn't the demographics. It's the behavioral history. Every transaction linked to that loyalty ID becomes part of a timeline. You can now see that this particular customer shops every two weeks, usually on Saturdays, gravitates toward organic products, responds well to email promotions but ignores push notifications, and has been gradually spending less over the past three months.
That last insight? That's a churn signal. And you can't see it without the identity layer tying transactions together over time.
CRM systems also capture customer service interactions — complaints, returns, inquiries. If someone called in twice about a defective product and then stopped shopping, that's not a coincidence. It's a story, and the data tells it if you know where to look.
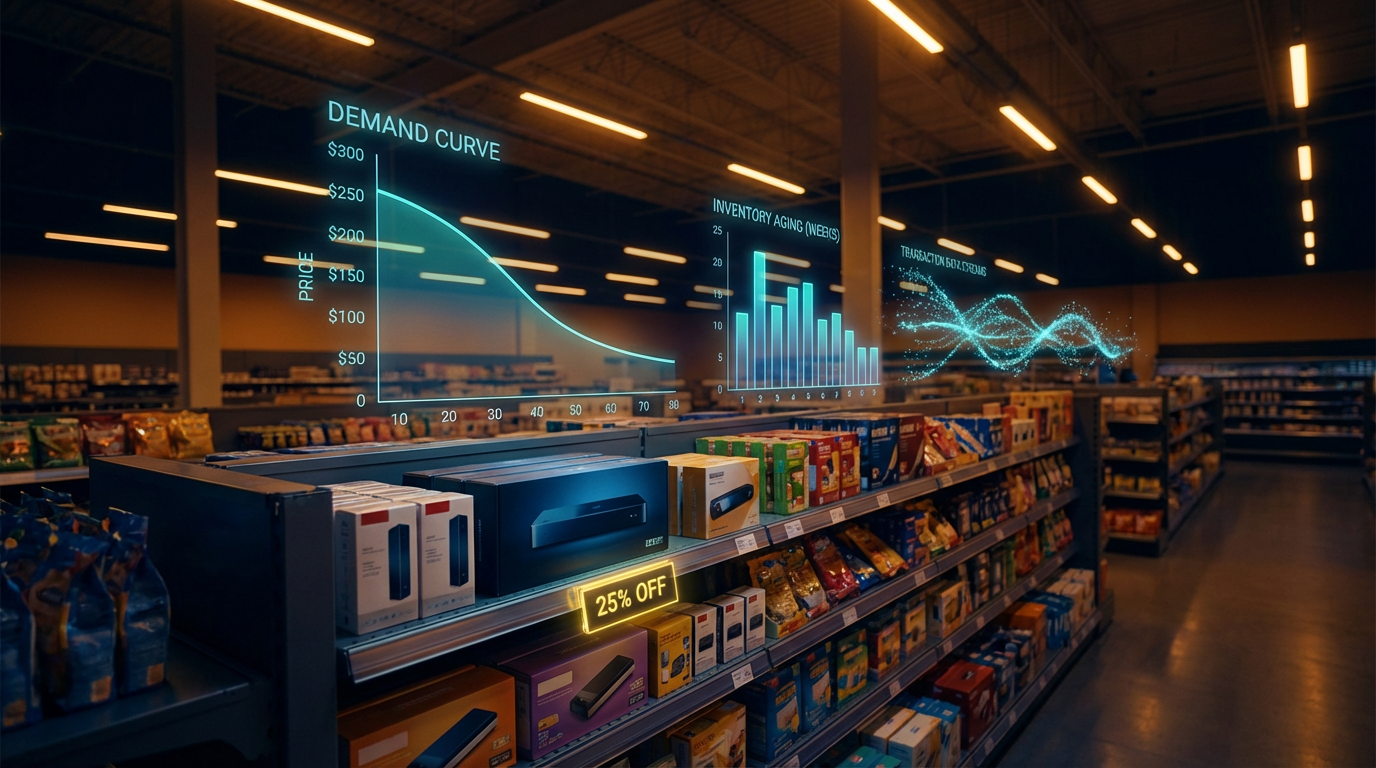
What's on the Shelf and Why: Inventory and Planogram Data
Here's a data source that most aspiring analysts don't even know exists: the planogram.
A planogram is essentially a blueprint for how products are arranged on shelves. It dictates what goes where, how many facings each product gets, and which items sit at eye level versus the bottom shelf. Retail companies invest serious money in planogram optimization because shelf placement directly impacts sales. That premium eye-level spot? Brands pay for it, and the data tracks the arrangement and its results.
Inventory data, meanwhile, is a constantly moving target. Inventory snapshots capture what's in stock at a given point in time — usually daily, sometimes more frequently for high-velocity categories. You'll see on-hand quantities, on-order quantities, in-transit quantities, and sometimes even warehouse bin locations.
Why does this matter for analytics? Because sales data alone can be deeply misleading. If a product shows zero sales for a week, does that mean customers didn't want it? Or does it mean the shelf was empty because a shipment got delayed? You can't answer that question without inventory data. The concept of "lost sales" — revenue you didn't earn because the product simply wasn't available — is one of the most important problems in retail analytics, and inventory data is the foundation for solving it.

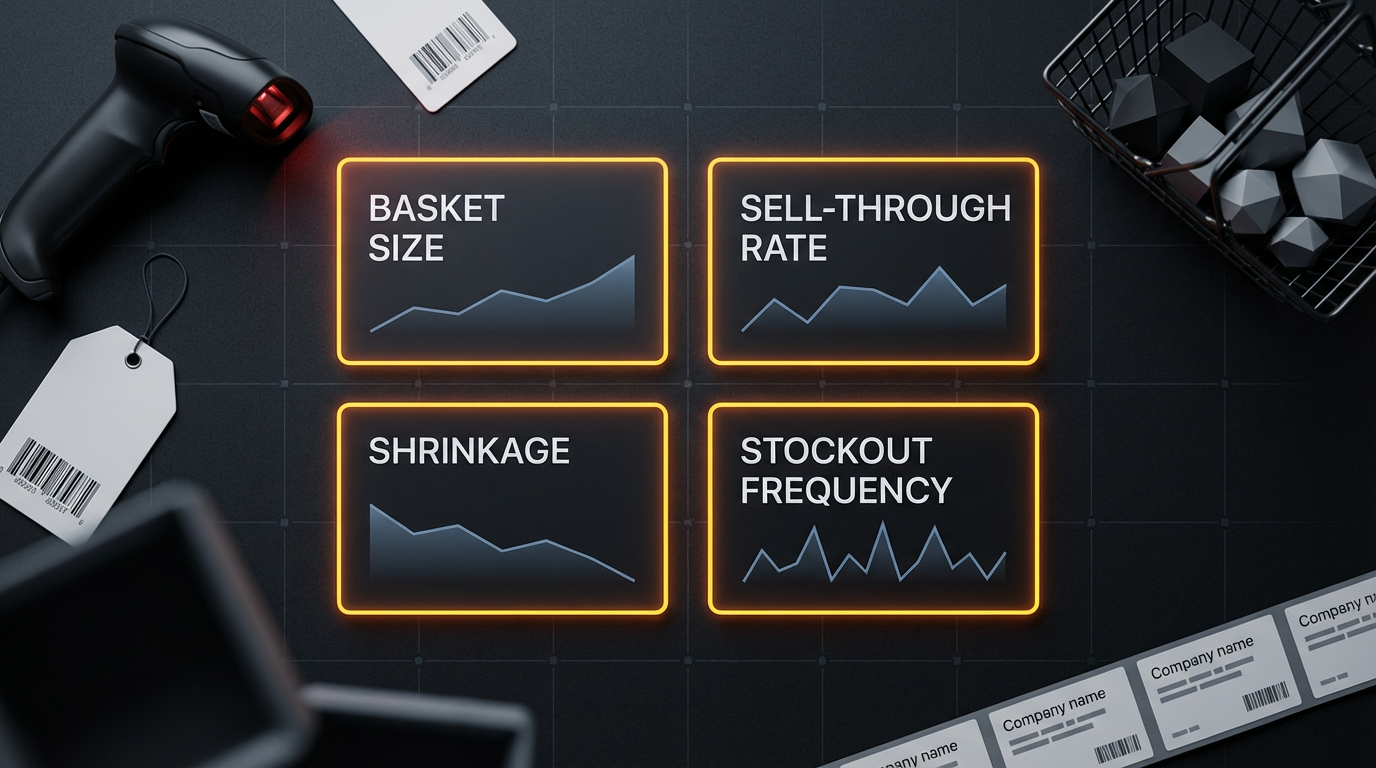
Watching the Flow: Foot Traffic and In-Store Sensors
Modern retail stores are increasingly instrumented. Foot traffic counters at store entrances track how many people walk in and out, usually broken down by hour. Some retailers use heat mapping technology that shows which sections of the store get the most foot traffic and which aisles are ghost towns.
This data opens up a metric that most people outside retail have never heard of: the conversion rate at a physical store level. If 1,000 people walked into your store today and 300 of them made a purchase, your conversion rate is 30%. If it was 35% last month, something changed — and now you have a thread to pull.
More sophisticated setups include dwell time analysis, which estimates how long customers spend in specific zones. Some retailers integrate this with promotional displays to measure whether that flashy endcap actually made people stop and look or whether they walked right past it. WiFi-based tracking, Bluetooth beacons, and even computer vision systems contribute to this data layer, though the depth varies wildly depending on the retailer's size and tech investment.
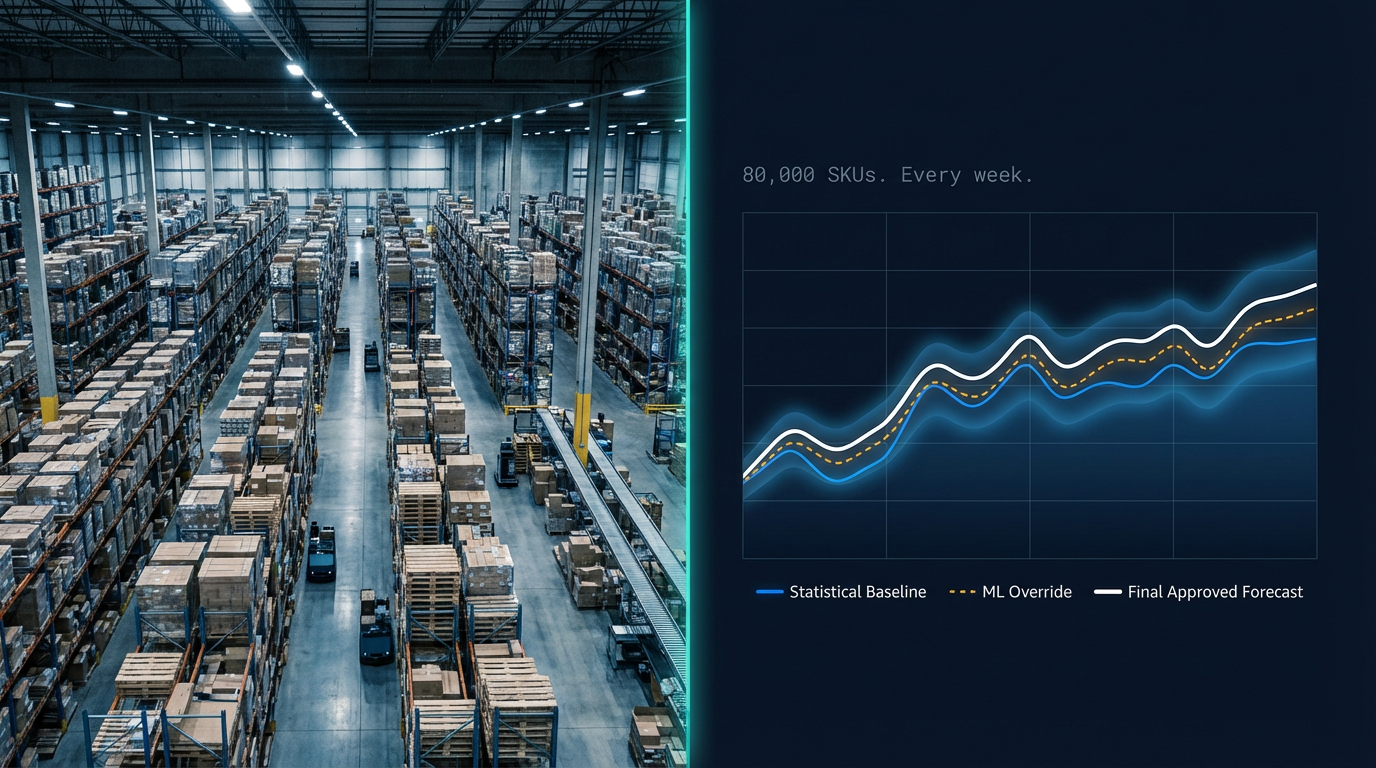
The Supply Chain Backbone: EDI Feeds and Supplier Data
Behind every product on the shelf is a supply chain, and that supply chain runs on data — specifically, Electronic Data Interchange (EDI) feeds.
EDI is the standardized format through which retailers and suppliers exchange business documents electronically. Purchase orders, advance shipping notices, invoices, inventory updates all of it flows through EDI. It's not glamorous, and it's not the kind of data that makes it into a data science bootcamp curriculum. But it's absolutely foundational.
When a retailer sends a purchase order (an "850" in EDI terminology) to a supplier, it's a structured document specifying what products are needed, in what quantities, at what price, delivered to which distribution center, by what date. When the supplier ships, they send an advance shipping notice (an "856") that details exactly what's in the shipment, down to the case pack level.
For an analyst, this data is gold when you're trying to understand lead times, supplier reliability, or cost fluctuations. If you're building a demand forecasting model, knowing that Supplier A consistently delivers three days late while Supplier B is always on time changes how you plan safety stock. That insight lives in the EDI data.
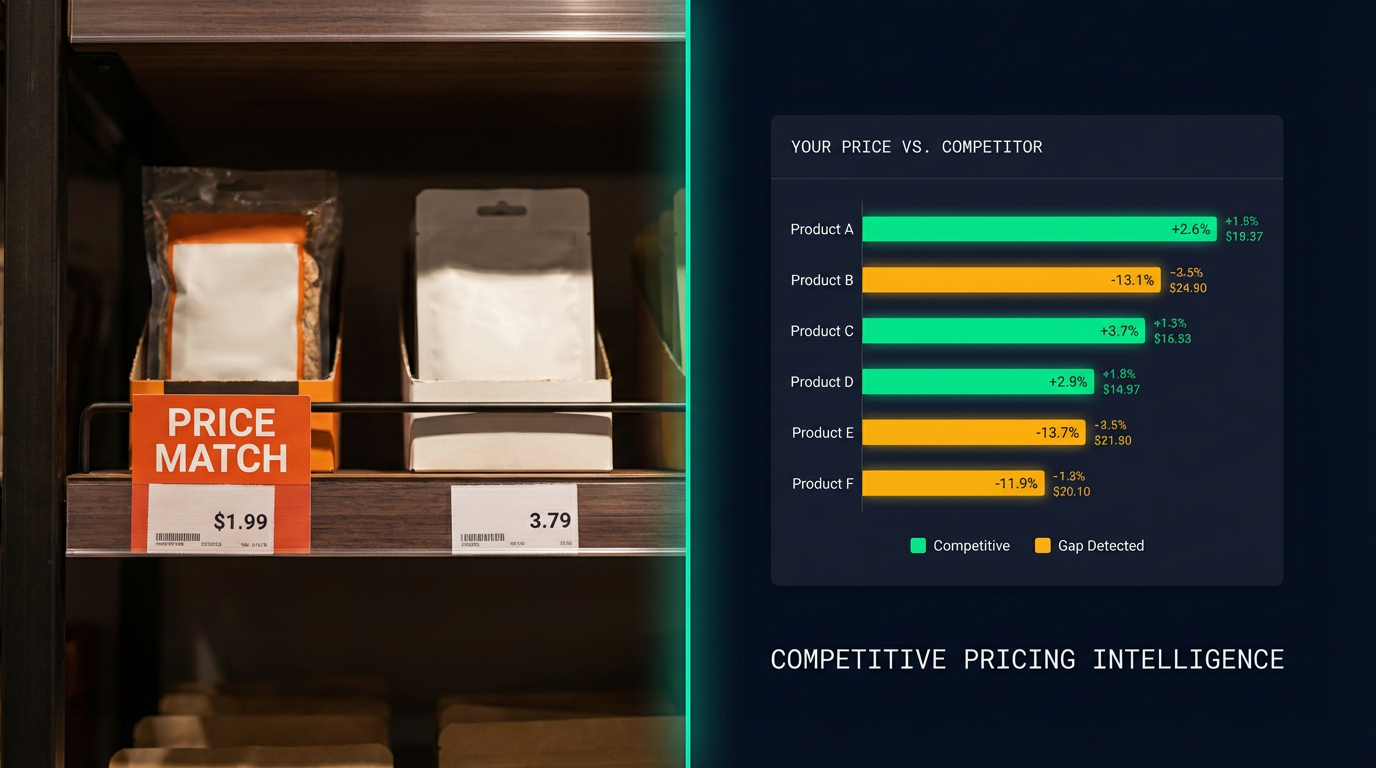
Pricing, Promotions, and the Complexity Nobody Warns You About
If you think pricing is straightforward — each product has a price, end of story — retail will disabuse you of that notion quickly.
A single product can have a regular shelf price, a promotional price, a loyalty member price, a competitor-matched price, a clearance price, and a regional price that differs by market. Prices can change weekly. Some change daily. And the data that tracks all of this is often scattered across multiple systems — a pricing engine, a promotional planning tool, a competitive intelligence platform, and sometimes a spreadsheet that a category manager maintains on their desktop.
Promotional data is its own universe. Every promotion has a type, such as buy-one-get-one, percentage discount, or bundle deal. It has a start and end date, a set of eligible products, a funding source (is the retailer eating the margin or is the supplier funding it?), and a planned versus actual performance record. Untangling this data to measure true promotional lift — the incremental sales a promotion generated beyond what would have sold anyway — is one of the classic hard problems in retail analytics.
The Digital Layer: E-Commerce and Omni-channel Data
For retailers with an online presence (which is nearly all of them now), there's an entire parallel data universe. Web clickstream data captures every page view, search query, filter applied, product added to cart, and abandonment event. It captures session duration, referral source, device type, and geographic location inferred from IP.
What makes this interesting — and complicated — is the omnichannel overlap. The same customer might browse online, add items to a cart, abandon it, receive a retargeting email, and then walk into a physical store and buy the product. Connecting that digital browsing behavior to the in-store POS transaction is one of the holy grails of modern retail analytics. It requires identity resolution across channels, and it's genuinely hard.
Buy-online-pickup-in-store (BOPIS) and ship-from-store data add more layers. These fulfillment methods blur the line between e-commerce and physical retail, and they generate their own data points around order timing, pickup windows, fulfillment speed, and substitution rates.
The Meta Layer: Master Data, Hierarchies, and the Boring Stuff That Makes Everything Work
None of the datasets above make any sense in isolation without master data. This is the reference data that defines what everything is.
Product master data includes the SKU, UPC, product description, brand, category, subcategory, size, pack count, and dozens of other attributes. Store master data defines each location's ID, address, format (supermarket vs. convenience vs. warehouse club), square footage, region, district, and operating hours. Vendor master data maps supplier codes to company names, contact information, and contract terms.
Hierarchies are what make roll-ups possible. A single SKU belongs to a subcategory, which belongs to a category, which belongs to a department, which belongs to a division. A single store belongs to a district, which belongs to a region, which belongs to a market. When someone asks "How did beverages perform in the Southeast this quarter?" — that question traverses both the product hierarchy and the store hierarchy simultaneously. If either hierarchy is wrong or inconsistent, the answer is wrong.
This is the data that nobody thinks about until it breaks. And when it breaks, everything downstream breaks with it.
Putting It All Together: Why This Map Matters
If you've read this far, you might be feeling a bit overwhelmed. That's actually the right reaction. A retail company's data ecosystem is vast, interconnected, and messy. No single system holds the complete picture. POS data lives in one place, inventory in another, supplier feeds in another, and loyalty data in yet another. The real work of retail analytics is often less about building models and more about understanding how these data sources connect, where they conflict, and which one to trust when they disagree.
This is what separates an analyst who can run a query from an analyst who can solve a business problem. The technical skills — the SQL, the Python, the modeling — are necessary. But they're not sufficient. You need the domain map. You need to know that when a category manager asks "Why did we lose share in snacks last month?" the answer might live in the POS data, or the inventory data, or the promotional calendar, or the planogram changes, or the supplier disruption that shows up in the EDI feeds. Probably some combination of all of them.
That understanding — that instinct for where to look and which datasets to combine — is what makes a retail analyst genuinely valuable. And it starts with knowing what data exists in the first place.
Now you have the map. The next step is learning how to use it.
This article is part of DSBootcamp's domain-focused analytics series, where we bridge the gap between textbook data science and how analytics actually works inside real companies.