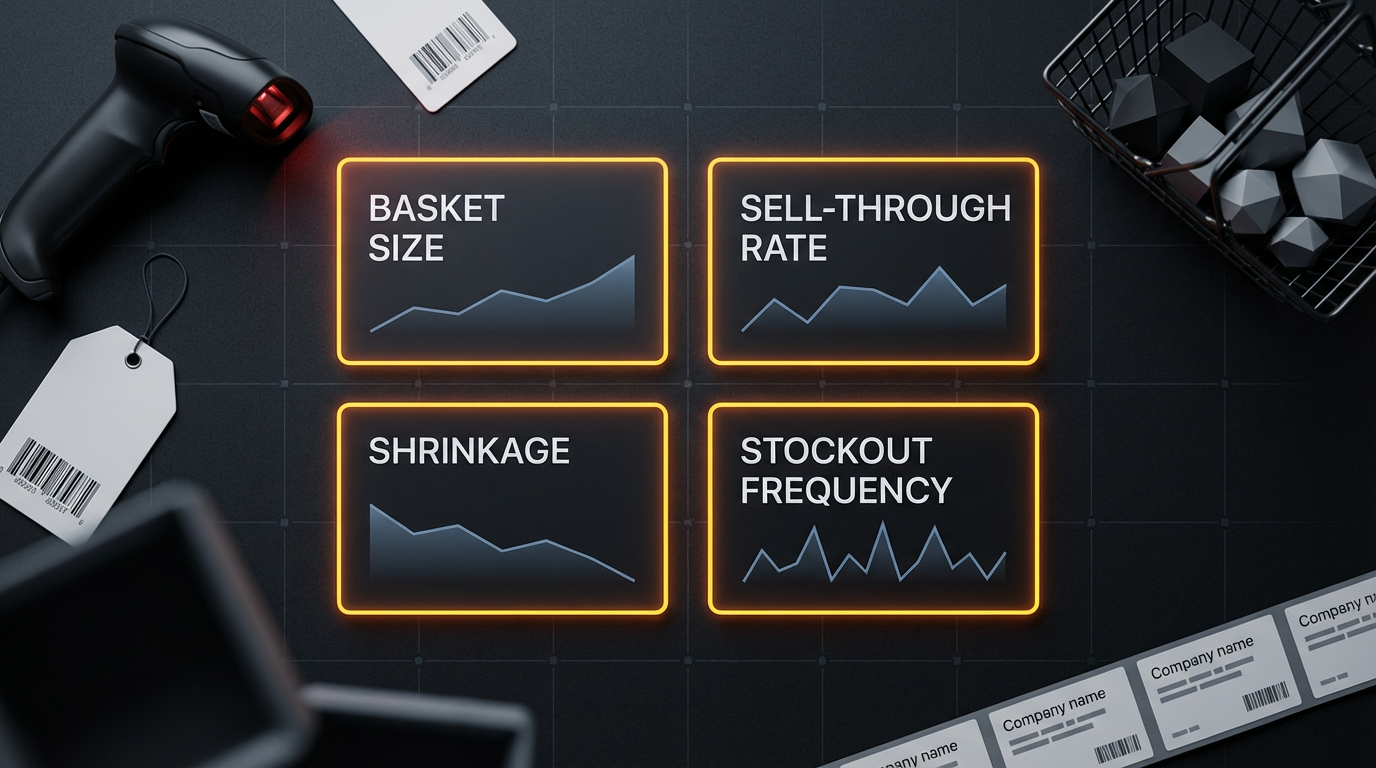
Revenue is a vanity metric. The numbers that matter in retail are basket size, sell-through rate, shrinkage, and stockout frequency. Here's what each one means and how they connect.
Every retail earnings call opens the same way. Revenue is up. Comparable store sales beat expectations. The stock moves. Analysts nod. And somewhere in a back-office analytics team, a senior merchant is staring at a completely different set of numbers — because she knows that revenue is the last thing you look at, not the first. Revenue is the outcome.
The KPIs that actually run a retail business are the ones that tell you why revenue moved, where it's about to break, and what needs fixing before the quarterly number lands. If you're building a career in retail analytics, or you're a data scientist trying to understand the domain you're working in, this is the mental model that separates the analysts who produce reports from the ones who drive decisions.
Why Revenue Is a Vanity Metric
This needs a moment, because it sounds counterintuitive. Revenue is real money. It matters enormously. But as a diagnostic tool, it's nearly useless on its own. Consider two stores, both reporting $2M in monthly revenue. Store A achieved that number with healthy basket sizes, strong sell-through on seasonal inventory, and minimal out-of-stocks. Store B hit the same number by heavily discounting aging inventory, running stockouts on its top-selling SKUs for two weeks, and losing 3% of merchandise to theft and administrative error. Same revenue. Completely different business health. Store A is compounding. Store B is quietly eroding. Revenue tells you the score at the end of the game. The KPIs below tell you how the game is actually being played — and they're the numbers that experienced retail operators check every single morning.
KPI 1 - Basket Size: The Engine of Revenue Growth
What it is: Average transaction value, or more precisely, the average number of units per transaction multiplied by average unit selling price.
Basket Size = Total Revenue / Number of Transactions
Basket size is deceptively simple and enormously important. In a world where customer acquisition costs are rising and foot traffic in physical retail is increasingly hard to drive, the most capital-efficient way to grow revenue is to sell more to the customers already in your store. Every percentage point increase in basket size flows directly to the top line without a corresponding increase in traffic acquisition costs.
The analytical depth comes from decomposing it. A basket size decline can mean two very different things: customers are buying fewer items per visit (units per transaction is down), or they're buying the same number of items but at lower average prices (mix shift toward cheaper products). These have completely different fixes. The first is a cross-selling and store layout problem. The second is a mix management and promotional strategy problem.
Sophisticated retail analytics teams track basket size by customer segment, day part, store format, and category penetration rate — the percentage of baskets that include at least one item from a given category. Low category penetration in a high-margin department is one of the clearest signals that a planogram redesign or a targeted promotion is worth the investment.
The connection to adjacent KPIs is direct: basket size inflates temporarily when you run aggressive promotions, which can mask a real underlying decline in organic purchase behavior. This is why you never look at basket size in isolation — you always look at it alongside the promotional discount rate to understand how much of the basket is being manufactured versus earned.
KPI 2 - Sell Through Rate: The Pulse of Inventory Health
What it is: The percentage of received inventory that sells within a defined period, typically a season or a planning cycle.
Sell-Through Rate = Units Sold / (Units Sold + Units Remaining) × 100
If basket size is the engine, sell-through rate is the transmission. It connects your buying decisions to your financial outcomes, and it's the single most important metric for any category or merchant team managing a planned assortment.
A healthy sell-through rate varies significantly by category. Fast-moving consumer goods — beverages, packaged food, household staples — should be turning almost continuously, with very high sell-through across weekly cycles. Seasonal categories like apparel, outdoor equipment, or holiday goods are typically managed against a target sell-through at the end of a selling season, often in the 85–90% range for well-run operations. Ending a season below 70% sell-through means you either bought too much, priced too high, or both — and the cost shows up as margin erosion through markdowns, clearance, and sometimes vendor return negotiations.
What makes sell-through analytically interesting is its relationship with time. A product at 60% sell-through in week four of a twelve-week season is in a very different position than the same product at 60% sell-through in week ten. The velocity trajectory matters as much as the absolute rate. This is exactly why the markdown timing models discussed in retail promotional analytics monitor sell-through velocity trends, not just point-in-time snapshots.
From a data science perspective, predicting end-of-season sell-through from early-season velocity signals is one of the more tractable and high-value forecasting problems in retail. Getting it right means buying teams can take corrective action — additional promotions, reorder decisions, vendor negotiations — while there's still time to change the outcome rather than simply accounting for it afterward.
KPI 3 - Shrinkage: The Silent Margin Killer
What it is: Inventory loss due to theft (external and internal), administrative errors, vendor fraud, and damage — expressed as a percentage of sales.
Shrinkage % = Inventory Losses / Net Sales × 100
Shrinkage is the KPI that most people outside the industry underestimate. The U.S. retail industry loses an estimated $100 billion annually to shrinkage. For a mid-size retailer operating on a 3–4% net margin, a shrinkage rate that drifts from 1.5% to 2.5% can erase a third of profitability without a single external competitive move happening.
The four components of shrinkage have different drivers and different fixes:
External theft is the most visible and the most discussed publicly, but it's typically not the largest component. Organized retail crime has grown, and high-value categories like health and beauty, alcohol, and electronics bear disproportionate losses.
Internal theft (employee theft) is, uncomfortably, often the largest single contributor in poorly managed operations. Loss prevention analytics teams build anomaly detection models on POS transaction data — patterns like excessive voids, discount overrides, or specific cashier-product combinations that deviate from store norms are early warning signals.
Administrative errors are invisible but significant: miscounts during receiving, incorrect unit-of-measure entries, wrong item scans, and inter-store transfer discrepancies all create phantom inventory or phantom losses that show up in shrinkage calculations without any actual theft occurring.
Vendor fraud — short-shipping, substituting lower-grade products, or billing discrepancies — is another component that analytical teams increasingly monitor through automated receiving reconciliation.
For a data scientist working in retail, shrinkage is a fascinating and underexplored domain. Most organizations have the transaction and inventory data needed to build meaningful anomaly detection and loss prediction models but haven't invested in the analytical infrastructure to use it systematically. The ROI on shrinkage analytics tends to be exceptional because the baseline problem is so large and the signal is often quite detectable once you look for it properly.
KPI 4 - Stockout Frequency: Where Revenue Goes to Die Silently
What it is: The percentage of time a SKU is unavailable for purchase during its intended selling window — either at zero on-hand inventory or below a functional minimum shelf quantity.
Stockout Rate = SKUs Out of Stock / Total Active SKUs × 100
Of all the KPIs in retail, stockout frequency is the one whose damage is most systematically underestimated, because the loss is invisible in your revenue data. You don't see a stockout in your sales figures. You see nothing — a flat line where there should have been demand. The customer who came for your top-selling item, found an empty shelf, and walked out or bought a competitor's product doesn't generate a transaction. She generates silence.
Industry research consistently shows that roughly 8% of retail shelf inventory is out of stock at any given moment in typical operations. The consumer response to stockouts is roughly split: about half of shoppers will substitute a different item (sometimes in your category, sometimes at a competitor), and the rest will delay purchase or abandon the trip entirely. For high-loyalty brand categories, the abandonment rate skews higher — a shopper who specifically came for a particular brand of baby formula or a specific prescription item will not substitute easily.
The KPI interacts with sell-through rate in a particularly insidious way: aggressive sell-through targets in buying and promotional planning sometimes create stockouts at the worst possible time. Hitting a 90% sell-through target three weeks before a selling season ends means you've been out of stock on your best items during the highest-demand period. You optimized one metric and destroyed another.
Analytics teams address stockout frequency through service-level modeling in replenishment systems — setting reorder points and safety stock levels that balance the carrying cost of excess inventory against the revenue risk of a stockout. The optimization looks like this at its core: the cost of holding one extra unit of safety stock versus the expected revenue loss from a stockout event, weighted by stockout probability. Getting this balance right category by category, store by store, is one of the genuine value-creation opportunities in retail supply chain analytics.
How These Four KPIs Talk to Each Other
The real sophistication isn't in understanding each metric in isolation — it's in reading the system they form together.
A retailer with strong basket size but deteriorating sell-through is probably using promotions to inflate transactions while sitting on excess inventory. The markdown cost is coming. A retailer with excellent sell-through but rising stockout frequency is under-buying and leaving revenue on the table during peak demand. A retailer with improving shrinkage metrics but falling sell-through may have solved their loss prevention problem by tightening a high-theft category so aggressively that the shopping experience suffered.
These four numbers, tracked weekly at the category and store level, give you a real-time diagnostic picture of a retail operation's health that no revenue figure can match. Revenue tells you what already happened. These KPIs tell you what's about to.
What This Means for Data Professionals
If you're building retail analytics systems, start here. These four KPIs aren't just business metrics — they're the feature engineering targets, the model evaluation criteria, and the decision thresholds that make your analytical work actionable.
Predicting basket size lift from a planogram change, forecasting sell-through velocity from early-season signals, detecting shrinkage anomalies in transaction logs, and optimizing safety stock against stockout probability — each of these is a well-defined, high-value modeling problem. Each has a clear business outcome. Each connects directly to how a retail business actually makes or loses money.
Revenue is the headline. These are the story.
---
This post is part of DSBootcamp's Retail Analytics series, where we unpack the metrics, models, and decision frameworks that drive real business outcomes — built for data scientists who want to understand the domain as deeply as the data.
---