
A/B Testing Results Explained: Lift, p-Values, and the Peeking Trap
5 min readEconometrics & Stats

DSBootcamp Team
Data Science Educators
On this page
Most A/B write-ups stop at "p less than 0.05, ship it." That is how teams ship noise, kill winning variants too early, and argue about lift percentages that nobody can reproduce.
This post does the opposite. You will download a real (synthetic but deterministic) checkout experiment, run the same SQL and Python we used, and read the results the way a careful analyst should: absolute and relative lift, a 95% confidence interval, a p-value with a plain-English meaning, and a peeking mistake that almost buried a clear win.
Download the data: experiment.csv (9,600 users, ~240 KB). Every number below comes from that file.
#What we are measuring
An online store tested a simplified checkout page for 14 days.
- Control: existing checkout
- Treatment: shorter form + clearer shipping total
- Primary metric: conversion (
converted = 1if the user completed an order) - Secondary: revenue among converters (not the decision metric)
Each row is one user:
| Column | Meaning |
|---|---|
user_id | Stable user key |
variant | control or treatment |
converted | 1 if purchased, else 0 |
revenue | Order value if converted, else 0 |
day | Experiment day 0–13 |
#Load the data and check balance
import pandas as pd
from math import sqrt
from statistics import NormalDist

df = pd.read_csv("experiment.csv")
print(df.groupby("variant").agg(
    n=("user_id", "count"),
    conversions=("converted", "sum"),
    rate=("converted", "mean"),
))
You should see roughly balanced arms (ours landed at 4,836 control and 4,764 treatment). Large imbalance is a randomization smell — pause before you celebrate any lift.
The same check in SQL (DuckDB, BigQuery, or Postgres):
SELECT
  variant,
  COUNT(*) AS n,
  SUM(converted) AS conversions,
  AVG(converted) AS conversion_rate
FROM experiment
GROUP BY 1
ORDER BY 1;#The results table (full 14 days)
| Variant | Users | Conversions | Conversion rate |
|---|---|---|---|
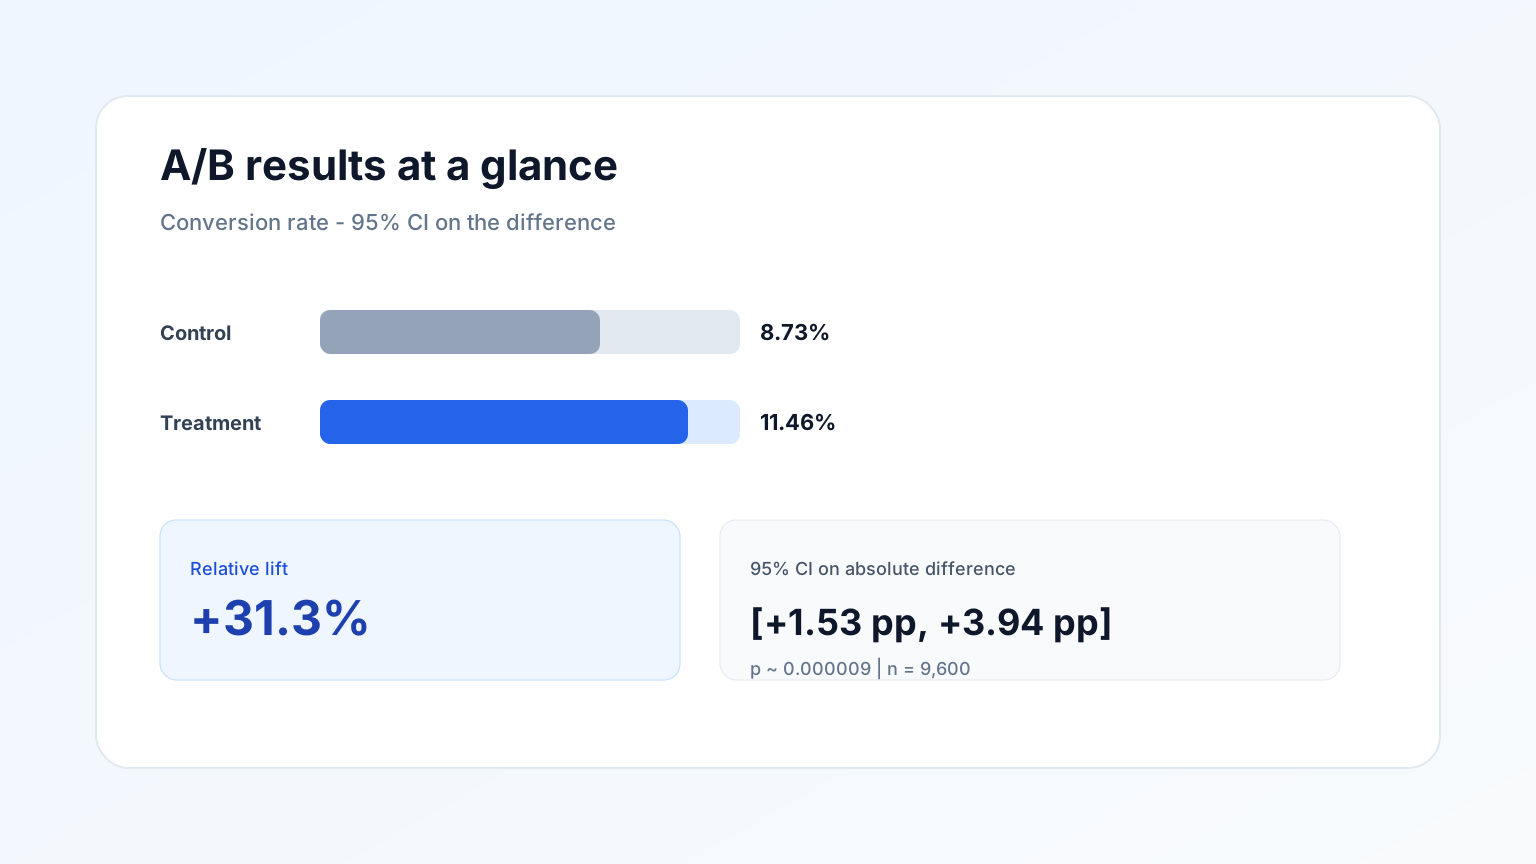
| Control | 4,836 | 422 | 8.73% |
| Treatment | 4,764 | 546 | 11.46% |
Absolute difference: +2.73 percentage points.
Relative lift: +31.3% (= 2.73 / 8.73).
#The two-proportion z-test, line by line
For conversion rates pc and pt with sample sizes nc and nt:
SE = sqrt( pc*(1-pc)/nc + pt*(1-pt)/nt )
z = (pt - pc) / SEc = df[df.variant == "control"]["converted"]
t = df[df.variant == "treatment"]["converted"]
pc, pt = c.mean(), t.mean()
nc, nt = len(c), len(t)
se = sqrt(pc * (1 - pc) / nc + pt * (1 - pt) / nt)
z = (pt - pc) / se
p_value = 2 * (1 - NormalDist().cdf(abs(z)))
ci_low, ci_high = (pt - pc) - 1.96 * se, (pt - pc) + 1.96 * se
print(f"z={z:.2f} p={p_value:.6f}")
print(f"95% CI on difference: [{ci_low*100:.2f} pp, {ci_high*100:.2f} pp]")On this file that prints:
- z ≈ 4.45
- p ≈ 0.000009
- 95% CI on the absolute difference: [+1.53 pp, +3.94 pp]
Plain English: if the two pages converted the same, a gap this large would be extremely rare. The interval also stays entirely above zero, so the result is not a fragile p-value that flips when you squint.
#What the p-value is — and is not
The p-value answers one question: assuming the null (equal rates), how surprising is this data?
It does not answer:
- the probability the treatment is better
- the probability you will see the same lift next month
- whether the change is worth the engineering cost
For size and uncertainty, read the confidence interval. For decision making, bring a minimum detectable effect you agreed on before launch — for example "we only ship if the lower CI bound is above +1 pp."
#The peeking trap (day 2 almost killed a winner)
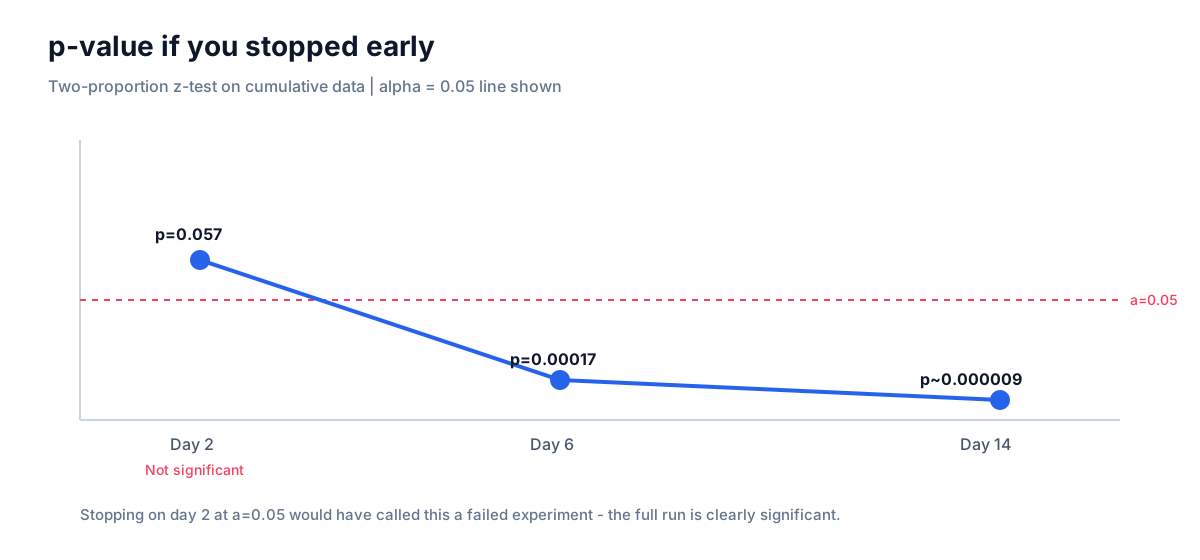
Teams love to "just take a quick look." Here is what that look would have shown on day 2 (first ~21% of traffic):
| Checkpoint | Control rate | Treatment rate | p-value |
|---|---|---|---|
| Day 2 | 9.16% | 11.72% | 0.057 |
| Day 6 | 8.65% | 11.95% | 0.00017 |
| Day 14 (full) | 8.73% | 11.46% | 0.000009 |
On day 2, at α = 0.05, an impatient analyst calls the test a failure and rolls back. The same experiment, run to the planned sample, is a clear win.
early = df[df["day"] <= 2]
# Re-run the same z-test on `early` — you should get p ≈ 0.057
If you need interim looks, use a sequential testing design (or pre-declared peek schedule with alpha spending). Do not reuse a fixed-horizon z-test as a daily stop/go button.
#A practical decision checklist
- Pre-register the primary metric, α, power, and MDE before traffic starts.
- Check balance and data quality before any lift math.
- Report absolute + relative lift and the 95% CI.
- Treat p-value as evidence against the null, not a ship button.
- Do not peek with a fixed-horizon test.
- Separate primary (conversion) from guardrails (revenue per user, latency, refund rate).
Want more practice reading noisy product data? Work through a business case study or drill practical statistics on DSBootcamp — same habit of verifying numbers from the raw table.
#Where to go next
Re-run the notebook on the CSV above, then deliberately cut the file to day 2 and day 6 so you feel the peeking mistake yourself. When you are ready to turn experiment literacy into interview signal, pair this with hypothesis-testing problems on the practice tracks.
Frequently asked questions
What is relative lift in an A/B test?
Relative lift is (treatment rate − control rate) / control rate. In our experiment that is (11.46% − 8.73%) / 8.73% ≈ +31.3%. Absolute lift is the raw difference in percentage points (+2.73 pp). Report both — relative lift sounds bigger; absolute lift is closer to business impact.
What does a p-value of 0.000009 mean here?
Under a two-proportion z-test of H0: the two conversion rates are equal, seeing a difference this large (or larger) would happen about 9 times in a million if the null were true. That is strong evidence against H0, but it is not the probability that the treatment is better, and it says nothing about practical size — use the confidence interval for that.
Why is peeking at interim results dangerous?
Every time you look and decide to stop, you spend Type I error. Our day-2 snapshot had p ≈ 0.057 — above α = 0.05 — so a peeking analyst might have stopped and shipped nothing. By day 14 the same test is p ≈ 0.000009. Fix the sample size (or use a sequential design) before you launch.
How big a sample do I need for an A/B test?
It depends on baseline rate, the minimum detectable effect you care about, α, and power (often 80%). For ~9% baseline and a ~2.5 pp absolute lift, a few thousand users per arm is in the right ballpark — we used 4,836 control and 4,764 treatment. Undersizing is the most common reason teams chase noise.
Should I use a t-test or a z-test for conversion?
Conversion is a Bernoulli outcome, so a two-proportion z-test (or a chi-squared test on the 2×2 table) is the direct fit. A t-test on revenue can make sense for continuous metrics. Match the test to the metric; do not run every test you know on the same experiment.
 DSBootcamp Team