Supplier Performance Scorecard: Multi-Metric Benchmarking and Ranked Comparison
Supply Chain & Logistics
Supplier Performance Scorecard: Multi-Metric Benchmarking and Ranked Comparison
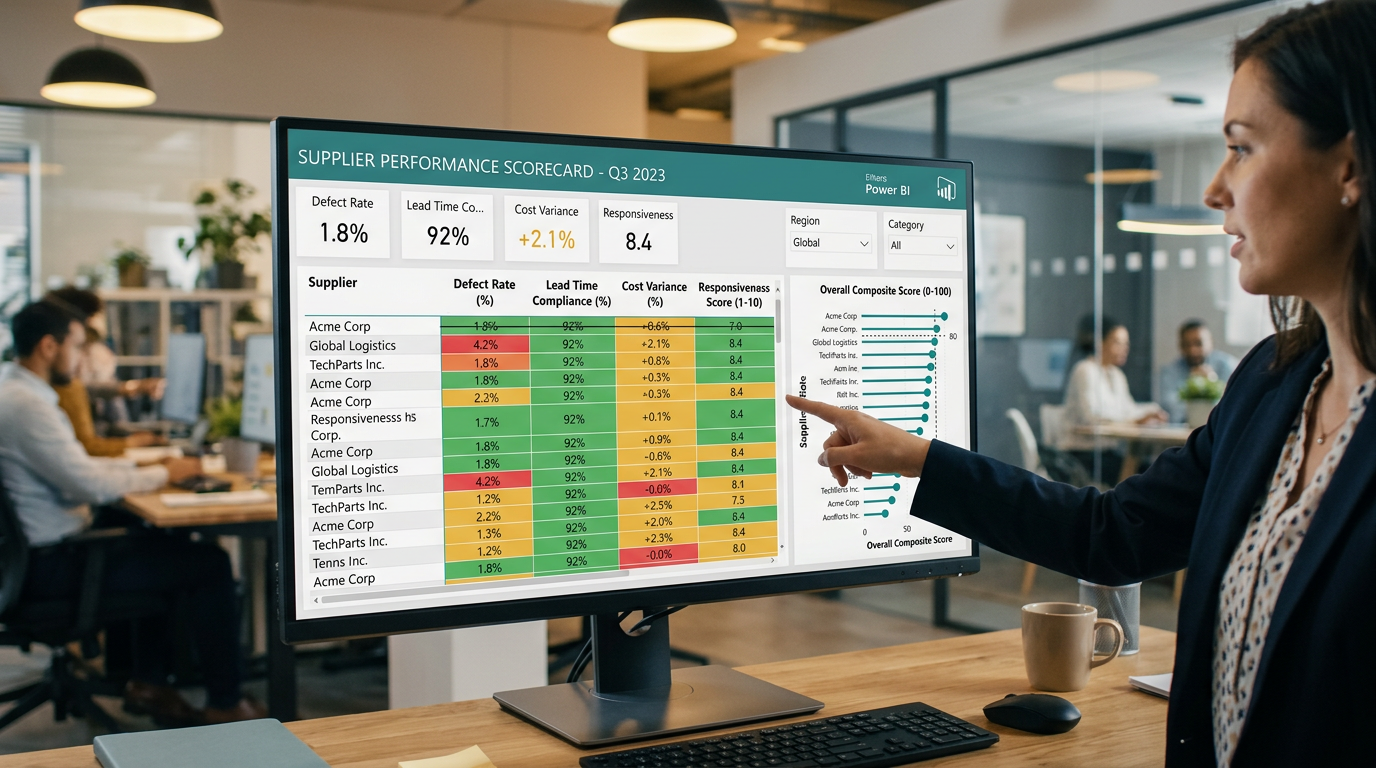
Your best supplier on paper is your worst on quality
Problem Statement
The Scenario
Nexara Consumer Goods is a mid-market manufacturer of household and personal care products with operations across North America. The company sources raw materials and packaging components from seventy-five active suppliers distributed across four vendor tiers. Over the past two fiscal years, the Head of Procurement has received escalating complaints from production planning: shipments arriving with quality defects, lead times slipping past agreed windows, invoiced costs consistently running above purchase order prices, and suppliers taking days to respond to urgent queries. Each of these problems has been tracked separately in different systems — quality inspections in one spreadsheet, invoice variances in another, delivery logs in the ERP. No one has ever seen all four dimensions of supplier performance in a single view, and contract renewal decisions worth millions of dollars are coming up in the next quarter.
The Data Challenge
You have been provided three data files. The first is a fact table at the purchase order evaluation grain — one row per PO assessed across the two-year window, capturing four measured performance dimensions for each transaction: defect rate as a percentage of units received, lead time compliance as actual versus promised lead time in days, cost variance as the percentage difference between invoiced amount and PO price, and a responsiveness score rated on a one-to-five scale based on supplier query turnaround time. The second is a supplier dimension table containing each supplier's tier, category specialization, geographic region, and contract status. The third is a benchmark reference table containing internal performance targets and simulated industry benchmark values for each of the four metrics. Your modeling challenge at this difficulty level is joining three tables — the fact table to the supplier dimension and to the benchmark table — and then building calculated fields that compare each supplier's aggregated performance against both the internal target and the industry benchmark simultaneously. This dual-reference comparison is what makes a scorecard genuinely useful rather than just a ranked list.
What's at Stake
This scorecard will be the primary input for Nexara's quarterly supplier review, attended by the Head of Procurement, the VP of Operations, and category managers responsible for each supplier relationship. Three decisions depend directly on it: which suppliers will be placed on a formal performance improvement plan, which contracts will be renegotiated or put out to tender, and which supplier tier classifications need to be revised based on actual performance rather than historical relationship. A supplier showing red across two or more metrics faces contract review regardless of commercial relationship history. The dashboard runs live during the supplier review meeting — it is not a PDF summary but an interactive tool that category managers filter by their own supplier portfolio during the session.
Data Schema
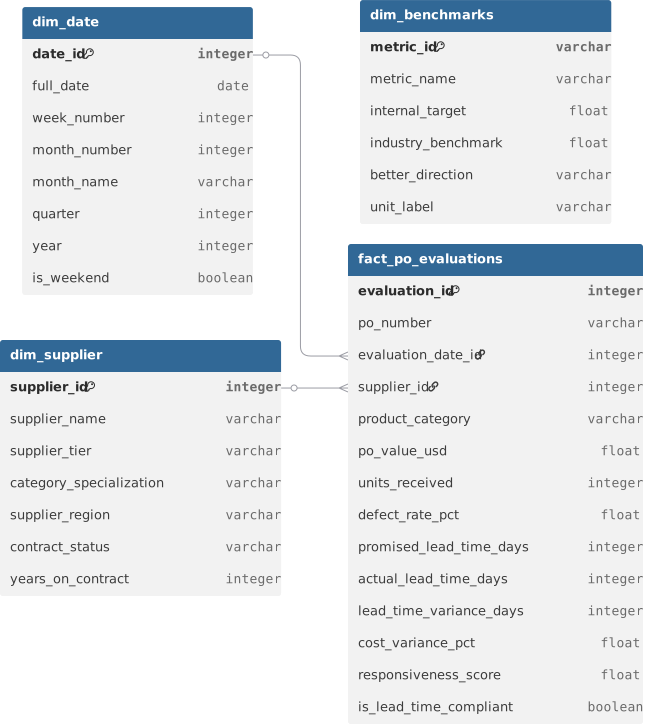
Datasets(4)
dim_benchmarks.csv
343 B
dim_supplier.csv
5.7 KB
dim_date.csv
30.2 KB
fact_po_evaluations.csv
1.4 MB