Scatter Plot and KPI Scorecard: Marketplace Seller Performance — GMV, Ratings, and Churn Risk
E-Commerce & Marketplaces
Scatter Plot and KPI Scorecard: Marketplace Seller Performance — GMV, Ratings, and Churn Risk
Which of your top sellers is one bad month away from leaving?

Problem Statement
The Scenario
Nexivo is a third-party marketplace platform based in Seattle, Washington, hosting over four hundred active sellers across eight product categories including Electronics, Fashion, Home and Kitchen, and Beauty. Nexivo operates a tiered seller program — Bronze, Silver, Gold, and Platinum — where tier determines commission rate, promotional placement, and access to fulfillment support. The platform processed approximately ninety thousand orders in 2024 generating a total GMV of eleven million dollars. Despite that headline number, the Head of Marketplace Operations has grown concerned that seller quality is bifurcating — a small cluster of top sellers is driving the majority of GMV while a growing tail of underperforming sellers is depressing average ratings, filing refund disputes, and quietly reducing their order volume before eventually leaving the platform. Leadership needs a seller performance scorecard that makes this bifurcation visible, assigns every seller to a performance quadrant, and flags sellers who show early churn signals before they become a retention problem.
The Data Challenge
You have been provided with four CSV files covering the full calendar year 2024. The first file, fact_orders, contains one row per completed order and includes the order value, quantity, and a seller rating given by the buyer at time of delivery — foreign keys link each order to the date, seller, and product category dimensions. The second file, dim_seller, contains one row per registered seller with their tier, category specialization, platform join date, and a country of operation. The third file, dim_category, contains one row per product category with a name and category group. The fourth file, dim_date, is the standard calendar table covering all 366 days of 2024. Your modeling task at difficulty 5 is to connect the fact table to all three dimension tables, build a seller-grain aggregation layer using calculated fields — Total GMV per seller, Total Orders per seller, Average Rating per seller, and MoM Order Trend — and then use those aggregations as the basis for the scatter plot and quadrant classification. The quadrant logic requires two calculated reference values: the median GMV threshold and the median rating threshold, both of which you must compute and use as dynamic parameters or fixed reference lines.
What's at Stake
The Seller Performance Scorecard will be reviewed monthly by the Head of Marketplace Operations and quarterly by the VP of Partnerships. Every element of the dashboard connects to a real operational decision: Stars are candidates for exclusive promotional placement and reduced commission rates as retention incentives. Sleepers are high-quality sellers with undiscovered volume potential — the partnerships team should reach out to understand what is blocking growth. At-Risk sellers have strong GMV but declining satisfaction scores, making them a platform reputation liability that needs immediate account management intervention. Churners are already disengaging — they need to be triaged quickly to determine whether recovery is worth the cost or whether they should be offboarded cleanly. If more than fifteen percent of total platform GMV is concentrated in sellers flagged as At-Risk, the operations team is authorized to launch an emergency seller health program. This dashboard is the trigger for that decision.
Data Schema
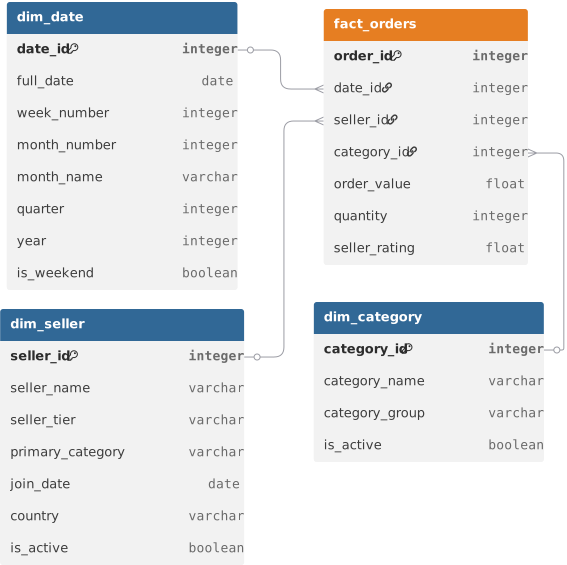
Datasets(4)
dim_category.csv
310 B
dim_date.csv
16.1 KB
dim_seller.csv
26.5 KB
fact_orders.csv
2.9 MB