KPI Dashboard: Marketplace Health Monitoring — GMV, Orders, and Average Selling Price
E-Commerce & Marketplaces
KPI Dashboard: Marketplace Health Monitoring — GMV, Orders, and Average Selling Price
Is your marketplace growing — or just getting busier?

Problem Statement
The Scenario
Vendara is a mid-size e-commerce marketplace headquartered in Austin, Texas, operating across twelve product categories including Electronics, Fashion, Home and Kitchen, and Beauty. The platform connects over three thousand active sellers with consumers nationwide and processed approximately fifty-two thousand orders in the last twelve months, generating a total Gross Merchandise Value of just over five million dollars. Despite strong order volume growth in the second half of the year, leadership has grown concerned that the platform is moving more orders without proportionally growing revenue — a signal that Average Selling Price may be declining. The CEO has requested a live marketplace health dashboard before the upcoming quarterly board presentation, one that tells the story of platform performance at a glance and supports real decisions about category investment and seller incentives.
The Data Challenge
You have been provided with three CSV files representing a full calendar year of order data from January through December 2024. The first file, fact_orders, contains one row per completed, cancelled, or returned order and includes the order value, quantity, platform channel, and foreign keys to the date and category dimensions. The second file, dim_date, is a pre-built calendar table with one row per date covering the full year, including week number, month, quarter, year, and a weekend flag. The third file, dim_category, contains one row per product category with a category name, parent group, and active status flag. Your modeling task is to connect fact_orders to both dimension tables using the correct foreign keys, then build calculated fields for GMV, Total Orders, and ASP. The Target vs Actual challenge requires you to compare monthly actuals against a set of static monthly targets provided in the problem — a common real-world pattern where targets live outside the transactional data.
What's at Stake
The Vendara VP of Growth reviews marketplace KPIs every Monday morning and the CEO reviews them monthly ahead of the executive team meeting. This dashboard will replace a manually assembled spreadsheet that currently takes an analyst four hours to produce each week. Every chart must connect to a real business lever: GMV trend informs whether promotional spend is paying off, order volume trend signals platform adoption, ASP trend identifies whether the platform is drifting toward low-value transactions, and the Target vs Actual view tells leadership immediately whether the month is on track or needs intervention. If ASP continues declining while order volume rises, the business faces a margin compression problem that no amount of order growth can fix — and this dashboard is the first line of visibility into that risk.
Data Schema
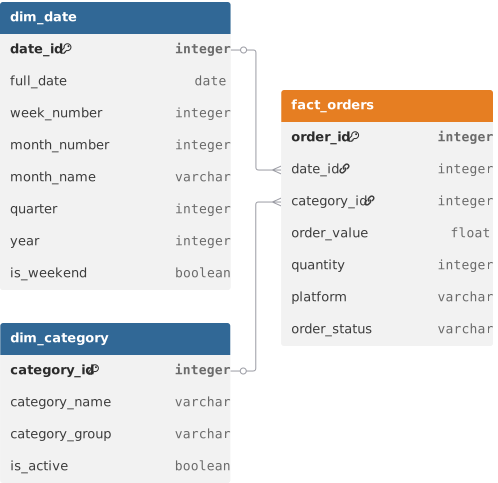
Datasets(3)
dim_category.csv
458 B
dim_date.csv
16.1 KB
fact_orders.csv
2.1 MB