KPI Dashboard: Loan Portfolio Health and Delinquency Monitoring
Finance & Banking
KPI Dashboard: Loan Portfolio Health and Delinquency Monitoring
Which loan segment is quietly pushing your default rate up?
Problem Statement
The Scenario
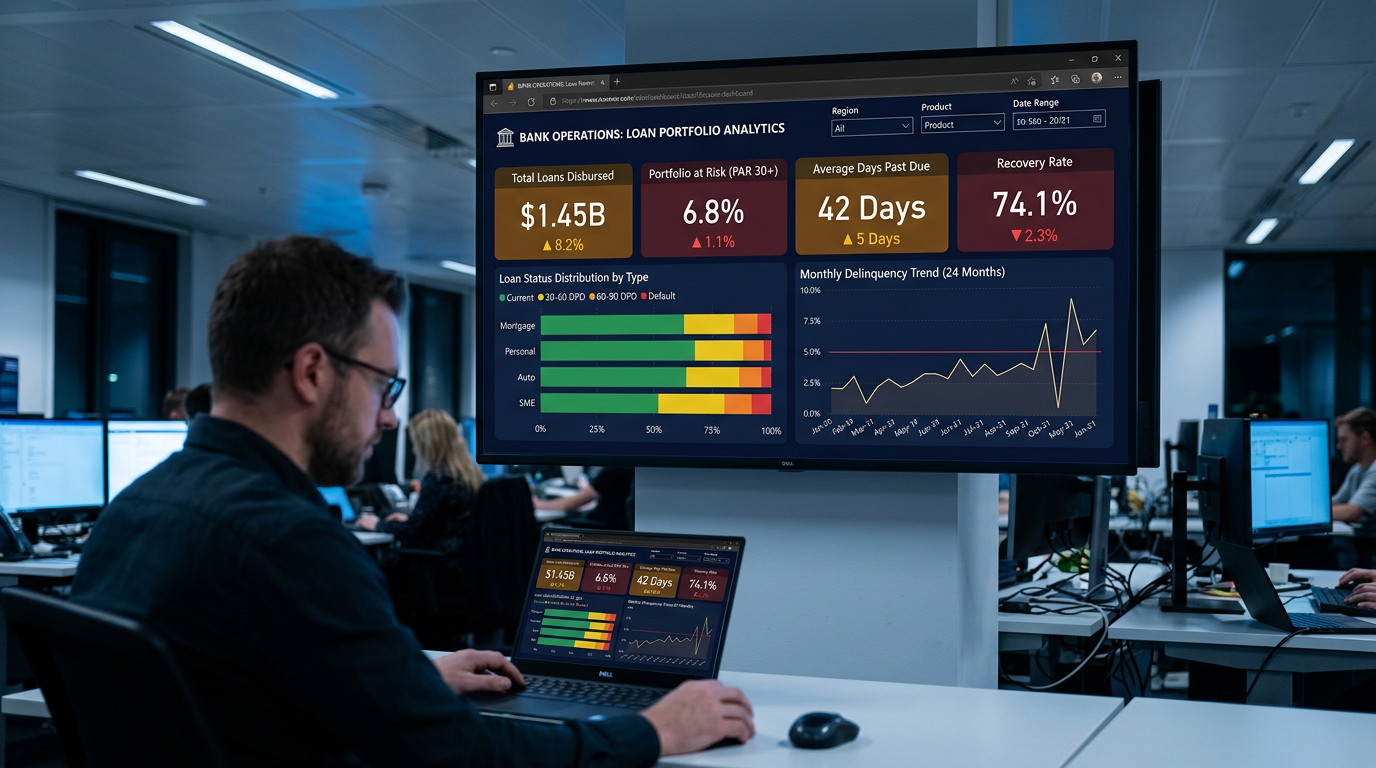
NorthBridge Community Bank is a mid-sized regional lender operating across six states in the American Midwest. The bank manages a loan portfolio of roughly two hundred active borrowers across personal loans, auto loans, and small business loans, with a total outstanding balance exceeding forty-two million dollars. Over the past two quarters, the credit risk team has flagged a rise in delinquency that is not evenly distributed — certain loan types and borrower segments appear to be deteriorating faster than others, but leadership has no single view to confirm or disprove this. The Chief Credit Officer has requested a consolidated Portfolio Health Dashboard to be reviewed every Monday morning before the weekly risk committee meeting.
The Data Challenge
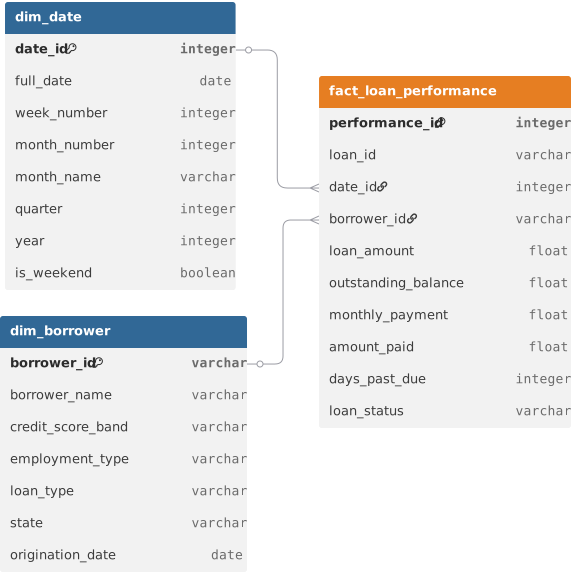
You have been given three tables. The first is a monthly snapshot fact table called fact_loan_performance, which records one row per loan per month and captures the current outstanding balance, amount paid that month, days past due, and loan status. This table spans twenty-four months from January 2023 through December 2024. The second is a borrower dimension table called dim_borrower, which holds one row per borrower and describes their credit score band, employment type, loan type, origination state, and the date their loan was originated. The third is a standard date dimension table called dim_date. Your task is to connect these three tables into a star schema in Tableau or Power BI, define the correct relationships, and build a KPI dashboard on top of this model. A key challenge at this difficulty level is correctly joining the date dimension to the fact table and using it to enable monthly filtering and trend views — a common stumbling block for analysts new to data modeling.
What's at Stake
The Monday morning dashboard will be used by the Chief Credit Officer and two regional loan managers to decide which borrower segments need proactive outreach, whether any loan type warrants a policy review, and whether overall portfolio risk is trending better or worse than the prior month. Every KPI card on the dashboard represents a potential action: a rising Days Past Due average may trigger a collections call campaign; a Portfolio at Risk above eight percent may escalate a formal credit policy review; a declining Recovery Rate may prompt a restructuring conversation with specific borrowers. This is a decision-grade dashboard — not decorative reporting — and it needs to be accurate, filterable by loan type and state, and refreshable with new monthly data without rebuilding the model.
Data Schema
Datasets(3)
dim_date.csv
32.9 KB
fact_loan_performance.csv
1.6 MB
dim_borrower.csv
60.2 KB