Funnel Chart: Visitor Drop-Off Analysis
E-Commerce & Marketplaces
Funnel Chart: Visitor Drop-Off Analysis
Where exactly are your customers vanishing before they buy?

Problem Statement
The Scenario
Carthex is a direct-to-consumer home decor and lifestyle brand based in Austin, Texas, selling exclusively through its own website. The brand launched four years ago and has grown to roughly twenty thousand monthly site sessions, driven by a mix of paid search, organic content, social media campaigns, and email marketing. Despite growing traffic, Carthex's monthly revenue has plateaued over the past two quarters. Leadership believes the problem is not awareness — the top of the funnel is healthy — but conversion. Somewhere between a visitor landing on the site and completing a purchase, a significant portion of potential customers are dropping off, and no one knows exactly where, how severely, or whether the problem is worse on mobile or from specific traffic sources. The Head of Growth has commissioned a funnel analysis dashboard to answer these questions before the next campaign budget cycle.
The Data Challenge
You have been given three CSV files covering the full calendar year 2024. The first file, fact_sessions, contains one row per web session and records the furthest funnel stage each session reached — from Visit through Product View, Add to Cart, Checkout Initiated, and Purchase Completed. Each session also carries a device type, a session duration, a pages viewed count, and foreign keys to the date and traffic source dimensions. The second file, dim_date, is a standard calendar table covering all 366 days of 2024 with week number, month, quarter, and weekend flags. The third file, dim_traffic_source, contains one row per acquisition channel with source name, source category, and a paid or organic flag. Your modeling task is to connect fact_sessions to both dimension tables, then build calculated fields that count the number of sessions reaching each funnel stage by treating each stage as a threshold — a session that reached Add to Cart is also counted in Visit and Product View. From these counts you will compute drop-off rates, absolute volume at each stage, and overall visit-to-purchase conversion rates.
What's at Stake
The funnel dashboard will be reviewed weekly by the Head of Growth and monthly by the VP of Marketing. Every chart must connect to a specific budget or product decision: the funnel shape identifies which stage deserves the most optimization investment, the drop-off by traffic source tells the performance marketing team which channels send high-quality versus low-quality traffic, and the trend line of conversion rates by month shows whether product and UX changes are moving the needle over time. The annotations layer — highlighting the single biggest drop-off point — ensures that every viewer, from analyst to executive, leaves the dashboard with the same understanding of where the revenue leak is. If the Checkout-to-Purchase drop-off is found to be above fifteen percent, the engineering team is authorized to begin a checkout redesign sprint. This dashboard is the trigger for that decision.
Data Schema
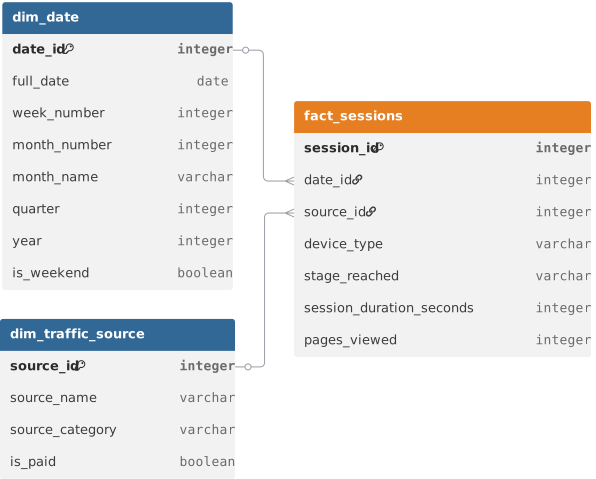
Datasets(3)
dim_date.csv
16.1 KB
dim_traffic_source.csv
206 B
fact_sessions.csv
863.9 KB