Customer RFM Segmentation and Behavioral Quadrant Analysis
Retail
Customer RFM Segmentation and Behavioral Quadrant Analysis
Your best customers are quietly drifting — do you know who they are?
Problem Statement
The Scenario
Vantara Retail is a direct-to-consumer lifestyle brand operating across thirty-eight physical stores and a growing online channel. Over the past two years the company has built a loyalty database of approximately two thousand registered customers who have made at least one purchase since January 2022. The Head of CRM recently flagged a concern that has been gaining urgency with the finance team: despite a growing customer count, repeat purchase rates have been declining quarter over quarter, and the top decile of customers — the ones who buy frequently and spend heavily — appear to be purchasing less often than they did eighteen months ago. The marketing team has been sending the same promotional emails to the entire customer base, with no differentiation between a customer who has bought twelve times this year and one who signed up six months ago and never came back. Leadership wants to stop treating all customers identically and start acting on behavioral segments.
The Data Challenge
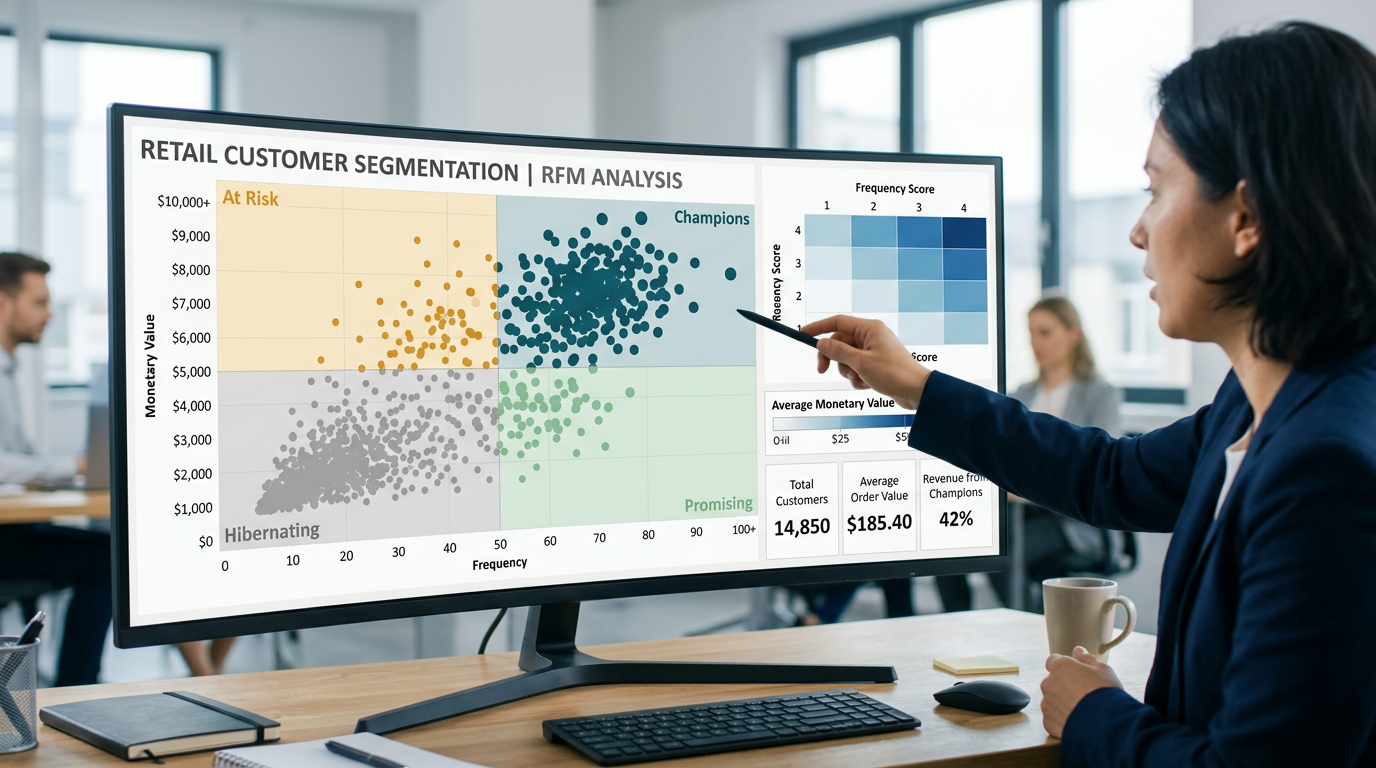
You have been provided with three tables. The first is a transaction-level fact table recording every purchase made by loyalty members from January 2022 through December 2023 — one row per transaction, with a customer ID, date, revenue, items purchased, and channel. The second is a customer dimension table with one row per customer capturing demographic and enrollment attributes. The third is a standard date dimension covering the full two-year window. Your task is to connect these three tables in the correct star schema and then build the RFM metrics entirely as calculated fields in your BI tool. Recency is the number of days since a customer's most recent transaction relative to the analysis date of December 31 2023. Frequency is the total count of distinct transactions per customer over the full two-year window. Monetary value is the total revenue generated by each customer over the same period. Once you have computed these three raw metrics, you will bin each into a score of one to four and use the combined score to assign customers to one of six named segments, which you will then visualize as a scatter plot and a heatmap.
What's at Stake
The CRM and marketing teams will use this dashboard monthly to drive three specific actions. First, the Champions segment — customers with top scores on all three dimensions — will be enrolled in a private loyalty tier with early access to new collections and personalized outreach; the dashboard needs to show exactly how many customers qualify and what share of total revenue they represent. Second, the At-Risk segment — customers who historically spent heavily but have not purchased recently — will receive a targeted win-back campaign; the business needs to know how many of these customers exist, what their average order value was in their active period, and how long ago their last purchase was. Third, the Hibernating and Lost segments will be used to set a suppression list, removing low-engagement customers from paid campaign audiences to reduce wasted spend. The dashboard will be reviewed every month by the Head of CRM and presented quarterly to the VP of Marketing as the primary lens for evaluating loyalty program health.
Data Schema
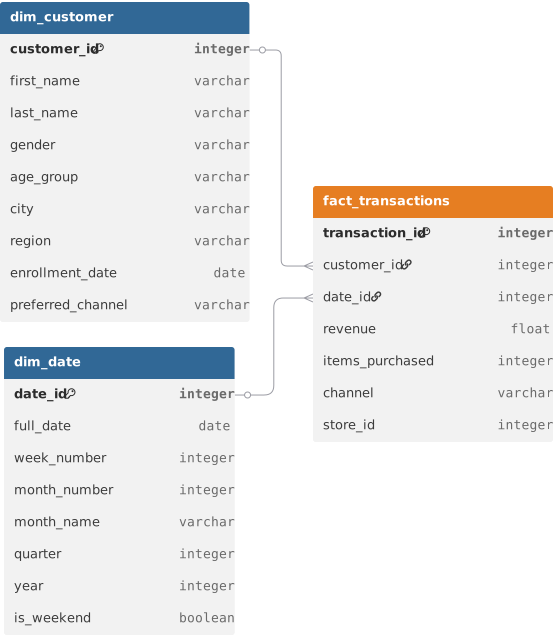
Datasets(3)
dim_customer.csv
151.2 KB
dim_date.csv
32.1 KB
fact_transactions.csv
361.0 KB