Calculated Fields and Multi-Metric Visualization
Finance & Banking
Calculated Fields and Multi-Metric Visualization
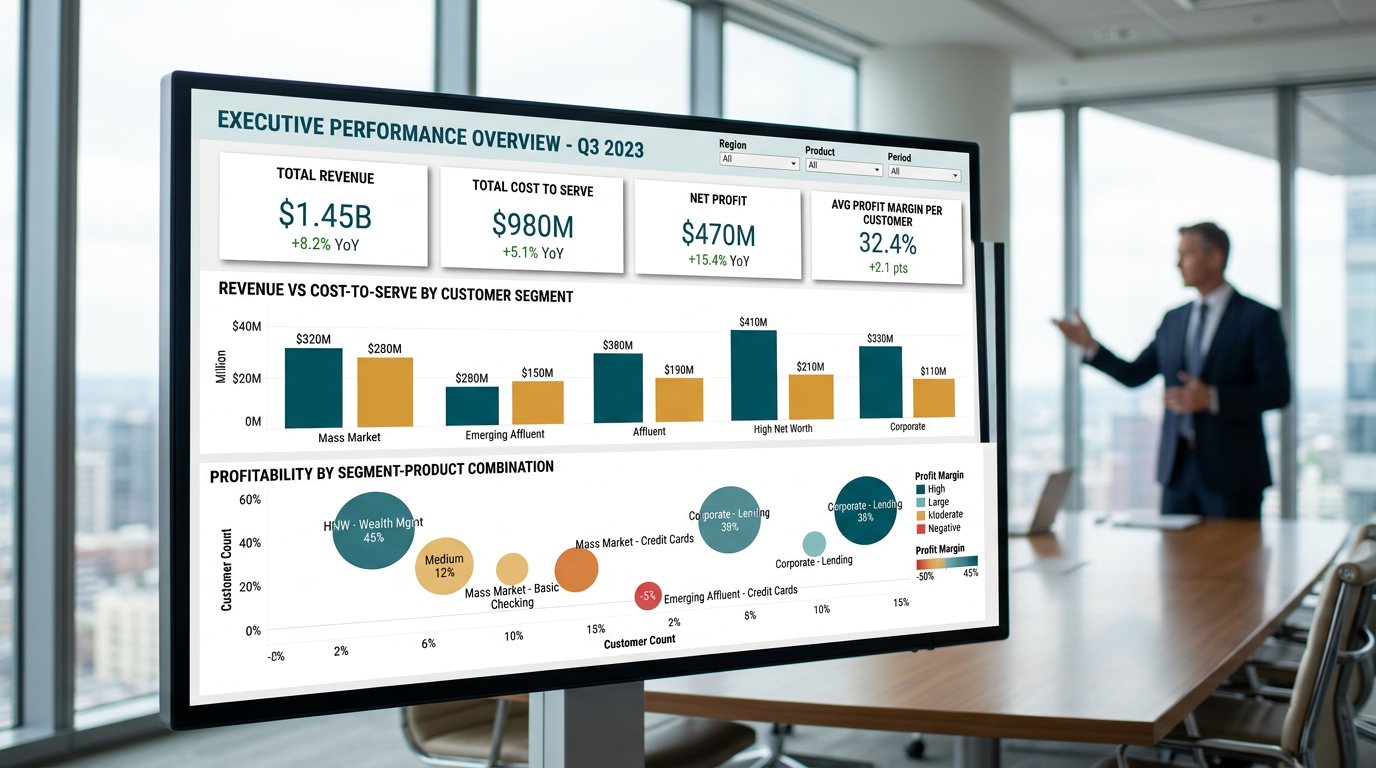
Which customer segment looks busy but earns you nothing?
Problem Statement
The Scenario
Meridian Financial Group is a full-service regional bank operating across eight states in the US Southeast. The bank serves approximately seven hundred thirty active customers across five distinct relationship tiers — Mass Market, Emerging Affluent, Affluent, High Net Worth, and Corporate. Each customer holds one or more banking products: savings accounts, checking accounts, credit cards, personal loans, mortgages, auto loans, and investment accounts. Over the past eighteen months, the Head of Retail Banking has observed that revenue growth has been modest despite a significant increase in the active customer base. The suspicion from the strategy team is that the bank has been acquiring and servicing a large number of low-margin customers while underinvesting in its highest-value segments. But without a consolidated profitability view across segment and product, no one can prove or disprove this hypothesis.
The Data Challenge
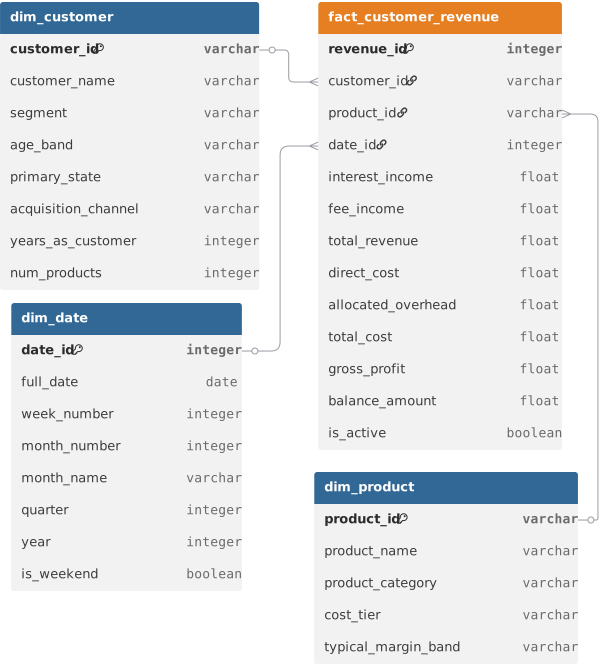
You have been provided with four tables. The first is a monthly fact table called fact_customer_revenue, which records one row per customer per product per calendar month and captures the revenue generated from that product relationship, the cost to serve that customer-product combination, and a set of derived profitability components. This table spans twenty-four months from January 2023 through December 2024. The second is a customer dimension called dim_customer, which describes each customer's segment tier, age band, primary state, acquisition channel, and years as a customer. The third is a product dimension called dim_product, describing each banking product, its product category, and a baseline cost-to-serve tier. The fourth is a standard date dimension called dim_date. Your task is to build the full four-table star schema in Tableau or Power BI, design calculated fields for gross profit and profit margin, and construct a multi-metric visualization that lets leadership compare profitability across segments and products simultaneously.
What's at Stake
The resulting dashboard will be reviewed quarterly by the Head of Retail Banking and the Chief Financial Officer to make three concrete decisions: which customer segments to prioritize in the next acquisition campaign, which product-segment combinations to retire or reprice, and where the cost-to-serve reduction program should focus first. The dashboard must be filterable by segment, product category, state, and time period. The profit margin calculated field is the centerpiece — it must correctly account for both interest income and fee income on the revenue side, and both direct servicing costs and allocated overhead on the cost side. A segment that looks profitable on revenue alone may appear very differently once cost-to-serve is applied, and that gap is exactly what this dashboard is designed to expose.
Data Schema
Datasets(4)
dim_customer.csv
40.3 KB
dim_date.csv
32.9 KB
dim_product.csv
378 B
fact_customer_revenue.csv
3.4 MB