Annotated Time Series: Promotional Campaign Impact and Sales Lift Analysis
Retail
Annotated Time Series: Promotional Campaign Impact and Sales Lift Analysis
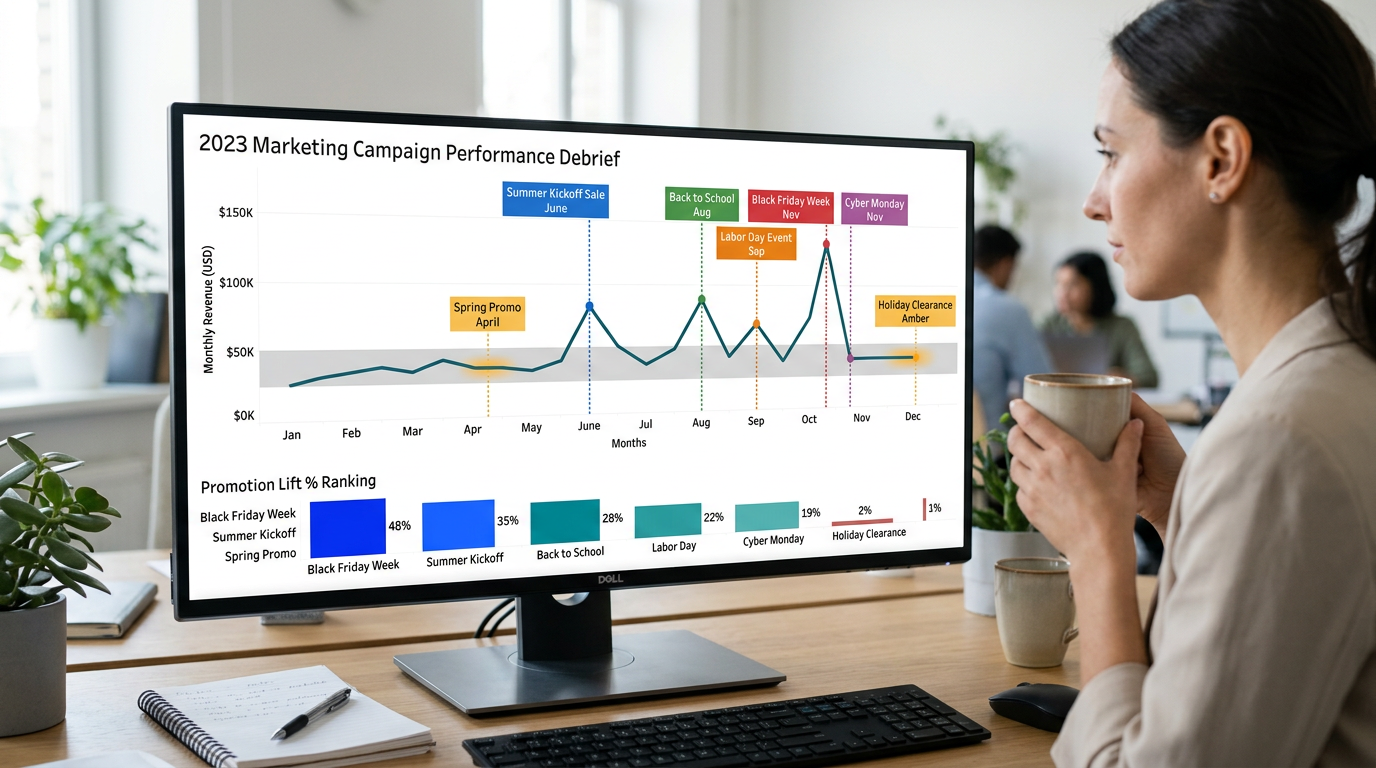
Are your biggest sale events actually moving the needle?
Problem Statement
The Scenario
Lumora Retail is a mid-sized lifestyle retail chain selling across five product categories — Apparel, Home and Living, Beauty, Sports, and Electronics — through forty-two stores nationwide and a growing e-commerce channel. In 2023 the marketing team ran eleven promotional campaigns across the calendar year, ranging from a New Year clearance event in January through a Black Friday week in November and a Holiday Grand Sale in December. Total promotional spend across these eleven events exceeded two point four million dollars. As the year closed, the VP of Marketing raised a question that nobody could answer cleanly from the existing weekly summaries: how much of our revenue growth actually came from the promotions we paid for, and which events produced real lift versus which ones simply captured demand that would have happened anyway?
The Data Challenge
You have been provided with three tables. The first is a daily fact table recording revenue, units sold, and transaction count at the product category level — one row per category per day, giving you approximately eighteen hundred rows of sales data across 2023. The second is a promotion dimension table containing one row per promotional campaign, including the campaign name, type, channel, discount percentage, start and end date, and the total budget spent on that event. The third is a standard date dimension covering every day of 2023. The fact table contains a nullable foreign key — promo_id — that is populated on days when a promotion was actively running for that category and is null on non-promotional days. Your task is to connect these three tables in the correct star schema, define a baseline revenue metric for non-promo periods, calculate lift as the percentage difference between promotional and baseline daily revenue, and build an annotated time series dashboard that makes it immediately visible which campaigns earned their spend.
What's at Stake
The marketing team is currently planning the 2024 promotional calendar with a budget of two point eight million dollars. Before they lock in the schedule, the VP of Marketing needs this dashboard to answer three questions: which 2023 promotions produced measurable sales lift above baseline; whether lift varied significantly by product category — meaning some categories respond to promotions and others do not; and whether discount depth correlates with lift, or whether the business is over-discounting on events that would perform equally well at a shallower discount. Regional managers will use the time series view to spot whether their stores followed the chain-wide trend during each event. The dashboard will be presented at the annual marketing planning session and will directly determine which event types get budget in 2024, which get cut, and which get redesigned.
Data Schema
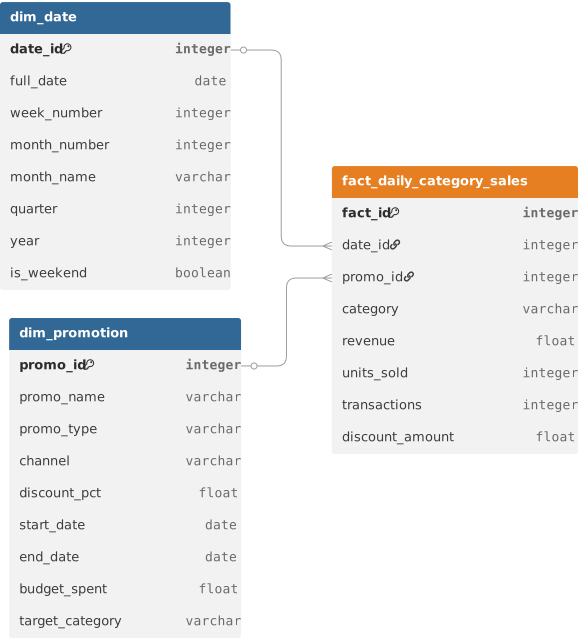
Datasets(3)
dim_date.csv
16.1 KB
fact_daily_category_sales.csv
78.0 KB
dim_promotion.csv
1.0 KB