Supplier Risk Intelligence: Segmenting Procurement Partners Using K-Means Clustering
Which suppliers are quietly strangling your supply chain?
Problem Statement
PinnacleCraft Industries is a mid-sized manufacturer of industrial components headquartered in Chicago, supplying automotive and aerospace clients across North America. Over the past three years, the procurement team has managed an active supplier base of 60 vendors spanning raw materials, electronic components, mechanical parts, chemical inputs, and packaging — sourced from suppliers across the US, Germany, China, Mexico, India, and beyond.
Recently, the VP of Operations flagged a growing crisis: multiple high-profile production stoppages traced directly to supplier failures cost the company an estimated $2.1 million in penalties and expedited freight charges in 2024 alone. Despite this, the procurement team has been applying the same management cadence to all 60+ suppliers — equal attention, equal follow-up intervals, equal trust. This one-size-fits-all approach leaves critical risks undetected until they escalate into production emergencies.
You have been engaged as a Data Analyst on a focused two-week assignment to build PinnacleCraft's first-ever supplier risk segmentation model. Using three years of purchase order history (January 2023 – December 2025, approximately 7,000 transactions), your task is to engineer meaningful risk features at the supplier level and apply K-Means clustering to group all 60+ suppliers into distinct, actionable risk tiers. The output will directly inform the procurement team's upcoming quarterly vendor review, enabling them to allocate oversight resources where they are actually needed — rather than spreading attention uniformly across vendors of vastly different reliability profiles. Your final deliverable is a segmented supplier risk table with clear tier labels and a profile summary for each cluster.
Stakeholder Requirements
--Engineer at least 3 supplier-level risk features from the purchase order data (average delivery delay in days, defect rate %, on-time delivery rate %) and confirm that these features show meaningful spread across suppliers before proceeding to clustering.
--Apply K-Means clustering using the Elbow Method to determine the optimal number of clusters (K), segment all 60+ suppliers into labeled risk tiers (Low / Medium / High Risk), and produce a summary table showing the average feature profile and supplier count for each risk tier.
Domain Understanding
Supply Chain & Supplier Management Overview
Supply chain management encompasses the coordination of goods, services, and information from raw material suppliers through to end customers. In manufacturing environments like PinnacleCraft's, supplier performance is not merely an operational metric — it is a direct determinant of production continuity, product quality, and customer satisfaction. Procurement teams manage supplier relationships across multiple dimensions simultaneously: price competitiveness, delivery reliability, incoming quality, and contractual compliance. The core challenge is that supplier risk is inherently multi-dimensional: a supplier might be cost-competitive but chronically late, or deliver on time while consistently short-shipping or sending defective parts. Most procurement teams track these metrics individually, but identifying composite risk across 60+ vendors in a systematic, data-driven way requires analytical tools beyond spreadsheet reviews. Clustering is a particularly powerful fit here because it finds natural groupings in multi-dimensional feature space — groupings that no single metric could reveal on its own.
Critical Metrics & Calculations
Four metrics anchor supplier risk assessment in practice:
1. Average Delivery Delay (Days)
Avg Delay = Mean(Actual Delivery Date − Promised Delivery Date) across all POs for a supplier.
A positive value means the supplier is, on average, N days late. This metric captures the magnitude of lateness, not just its frequency. A supplier consistently 3 days late is actually more plannable (you can build a buffer) than one that ranges from on-time to 20 days late.
2. On-Time Delivery Rate (OTD)
OTD Rate = (POs delivered on or before promised date / Total POs) × 100
The most universally tracked KPI in procurement. Industry benchmarks vary, but a healthy supplier typically achieves 90%+ OTD. A drop below 80% is considered a red flag in most manufacturing sectors.
3. Defect Rate
Defect Rate = (Total defective units / Total units delivered) × 100
Incoming quality failures are expensive — not just to scrap or rework, but because they're often discovered mid-production. A 5% defect rate means 1 in 20 parts fails inspection, which at high volumes translates to significant waste and line stoppages.
4. Order Fulfillment Rate
Fulfillment Rate = (Quantity Delivered / Quantity Ordered) × 100
Partial shipments force buyers to either delay production or source emergency fill-ins at premium cost. Suppliers who consistently short-ship — even if they deliver on time — impose hidden costs on operations.
Business Logic & Trade-offs
The goal of K-Means clustering in supplier segmentation is to surface natural groupings that aren't visible from any single metric in isolation. A supplier might have a good on-time rate but a high defect rate — making them a medium risk, not low risk, as a single-metric view would suggest. K-Means captures this multi-dimensional reality by finding clusters in combined feature space. For procurement teams, the key operational trade-off is between simplicity and nuance: two clusters (good vs. bad) is easy to act on but too blunt; four or more clusters are statistically interesting but hard to operationalize. Three clusters maps naturally to real-world procurement actions — low-risk suppliers get standard contract management, medium-risk get increased monitoring and quarterly improvement targets, and high-risk get active remediation plans or replacement sourcing.
One critical technical consideration: feature scaling is mandatory before K-Means. Delivery delay is measured in days (roughly 0–20), while defect rate is a percentage (0–20%). Without standardization, these ranges might appear similar, but adding a metric like total PO value (0–500,000) would completely dominate the distance calculations. StandardScaler (mean=0, std=1) ensures each feature contributes proportionally to the cluster assignments — a foundational preprocessing step for any distance-based algorithm.
ER Diagram
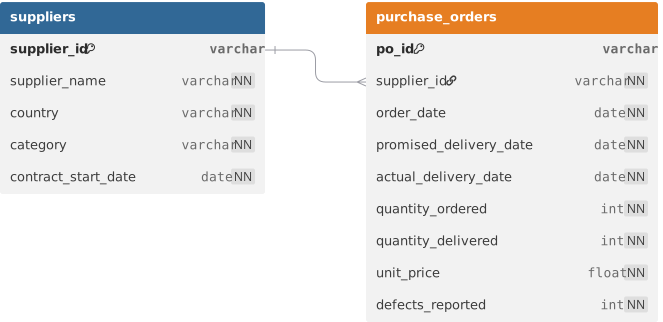
Loading the interactive workspace...