Stop Discounting Blind: A Data-Driven Markdown Optimization Framework for Fashion Retail
Is your discount strategy saving inventory or silently killing profit?
Problem Statement
Zephyr Retail Group is a mid-market fashion apparel retailer operating 12 stores across four US regions — three Flagship locations, six Standard full-price stores, and three Outlet stores. Zephyr introduces four seasonal collections per two-year cycle (Spring/Summer and Fall/Winter), with 12 new SKUs per collection spanning five product categories: Tops, Bottoms, Outerwear, Accessories, and Footwear. Each collection runs a lifecycle of 22 to 24 weeks on the floor before being replaced by the next season.
Over the past two years (2023–2024), Zephyr's merchandising team has been applying markdowns reactively — reducing prices when end-of-season calendar dates approach or when a buyer flags concern about a slow-moving item. The result is a patchwork of markdown decisions that were not consistently tied to sell-through data or category-level price sensitivity. Across 694 markdown events recorded in that period, 52% of all product-weeks across the store network were sold at a discounted price. Despite that level of discounting activity, the company's average end-of-lifecycle sell-through at Standard stores hovers at just 56% — far short of the industry benchmark of 80%. Meanwhile, gross profit margins on marked-down products vary dramatically by category: some recover margin through volume uplift; others, particularly Outerwear and Footwear, lose gross profit at deep discount levels regardless of how much inventory they clear.
Rachel Huang, VP of Merchandising, has commissioned an analytics review of Zephyr's markdown program. She wants answers to three questions the current reporting stack cannot answer: First, when in the product lifecycle is the right moment to trigger a markdown — and is the team currently marking down too late? Second, which discount depths by category actually improve gross profit, and which ones are destroying margin without meaningfully increasing sell-through? Third, are the markdown strategies being applied uniformly across store formats even though Flagship, Standard, and Outlet stores have structurally different sell-through profiles?
You are the data analyst brought in to conduct this review. You have been given two years of weekly sales data across all 12 stores and 48 active SKUs, a full register of 694 markdown events with start dates, discount depths, and markdown types, and supporting product and store dimension tables. Your task is to combine these sources, engineer the features needed for lifecycle and elasticity analysis, and produce a markdown optimization scorecard that gives Rachel a factual basis for rewriting the team's markdown decision rules before the next seasonal collection launches.
This is a diagnostic + prescriptive analysis. You are not building a demand forecast. You are answering: given what actually happened over two years of markdown activity, what does the data say about when to discount, how deep to go, and which categories and store formats need different rules?
Stakeholder Requirements
--Quantify the gross profit impact of markdown timing across the product lifecycle. Compare GP/store-week for markdowns triggered in the Launch phase (weeks 1–8) versus the Mid (9–14), Late (15–18), and Tail (19+) phases. State clearly whether Zephyr's current markdown timing pattern is eroding gross profit that could have been preserved by acting earlier.
--Identify which product categories benefit from markdowns (in GP/store-week terms) at each discount depth, broken down by bucket: 10–15%, 16–25%, 26–40%, 40%+. Specifically flag whether deep clearance (40%+) is financially viable for Footwear and Outerwear given their low price elasticity and thin margin profiles.
--Produce a SKU-level markdown optimization scorecard for Standard stores. Classify each product–store combination by its final sell-through outcome, discount history, and GP performance, and assign a clear actionable recommendation to each (e.g., "Mark Down Sooner," "Reduce Depth," "Review Buying — Deep Clearance Destroys GP," "No Change").
Domain Understanding
How Fashion Retail Inventory Works
Fashion apparel retail operates on a fundamentally different inventory logic than FMCG or commodity retail. Products have a fixed shelf life tied to seasonal relevance — a Winter coat commands full price in October, meaningfully less in February, and near-zero commercial relevance by May. This creates a ticking clock that every merchandising decision must account for. Retailers like Zephyr manage what practitioners call a product lifecycle curve: an introductory demand spike driven by novelty and newness, a stable full-price run period, a natural demand fade as the season matures, and a slow tail where only price-driven customers remain. The fundamental challenge of markdown optimization is deciding where on this curve to intervene with a price reduction — and by how much — to maximise the total gross profit extracted from a fixed quantity of opening inventory. Get it right and you hit the 80% sell-through target while preserving margin. Get it wrong in either direction — too early and you cannibalize full-price sales that would have happened anyway; too late and you go deep just to shift units that nobody wants at any reasonable price — and the financial impact compounds across hundreds of store-SKU combinations season after season.
Critical Metrics and Calculations
Sell-Through Rate (ST%): ST% = Cumulative Units Sold / Initial Inventory × 100. The primary inventory health metric in fashion retail. An 80% ST% by end of lifecycle is the widely accepted industry benchmark — it means the retailer recovered full-price or moderate-markdown revenue on 80% of stock, with the remaining 20% either carried over, transferred to outlet, or written off. A ST% below 60% at lifecycle end signals a buying error, a pricing error, or both.
Gross Profit (GP) per Store-Week: GP = Revenue − COGS = (Units Sold × Selling Price) − (Units Sold × Cost Price). This is the core optimization target in this analysis. Total units sold is not enough — a markdown that doubles unit velocity but cuts GP/unit by 60% is a net loss to the business. GP/store-week normalises for lifecycle-stage differences and allows fair comparison of markdown scenarios across timing, depth, and category. It is the single metric that answers both "did the markdown help?" and "was it worth it?"
Revenue Efficiency: Revenue Efficiency = Actual Revenue / (Units Sold × Intro Price). This metric answers: "Given that we sold N units in a given week, what fraction of full-price revenue did we recover for those exact N units?" A value of 0.88 at a 15% discount means the extra volume generated by the markdown did not fully offset the price cut in revenue terms. GP (which subtracts cost from both sides) is the more complete picture, but revenue efficiency is a useful intermediate diagnostic for understanding volume response by category.
Price Elasticity (simplified): In this context, elasticity is expressed as the demand uplift multiplier per 1% discount: Demand Uplift = 1 + Elasticity × (Discount% / 100). A category with elasticity 1.75 sees 17.5% more weekly units for a 10% discount. A category with elasticity 0.72 sees only 7.2% more units — rarely enough to offset the price cut in GP terms. Accessories are highly elastic (a price drop generates a strong volume response). Outerwear is inelastic (customers who will buy a $300 coat will buy it; those who won't are not moved by 20% off either). These embedded elasticities are what students should surface from the data in Step 3.
Markdown Depth Tiers: Practitioners group discount levels into decision-relevant tiers — Initial (10–20%), Deepened (25–35%), and Clearance (40%+) — because each tier represents a qualitatively different business decision. A 15% Initial markdown is a demand stimulus. A 50% Clearance markdown is an admission that the product failed and the goal is cost recovery, not profit.
Paragraph 3 — Business Logic and Trade-offs
The most important trade-off in markdown optimization is timing vs. depth. Conventional retail wisdom says mark down early and shallow rather than late and deep. The data in this case study is designed to quantify exactly why: a product marked down in weeks 1–8 (Launch stage) still has strong organic demand from the lifecycle curve — the markdown multiplies a healthy baseline, and the discounted price still clears margin comfortably above cost. The same product marked down in weeks 19+ (Tail stage) has a heavily suppressed baseline from lifecycle decay, meaning even a 25% discount generates fewer units and less GP than an earlier 15% markdown would have. The 71% GP/week decline from Launch to Tail markdowns that students will discover in Step 4 is not a model artifact — it is the combined effect of lifecycle decay and the compounding cost of inaction, and it appears consistently across all five product categories.
A critical complication is store format heterogeneity. Flagship stores in high-footfall locations like New York and Los Angeles naturally achieve higher sell-through at full price purely because of traffic volume — their markdown problem is less severe and less urgent. Outlet stores, by contrast, are structurally expected to run on thin margins and high discount dependency; applying the same markdown trigger rules as Standard stores to an Outlet is a category management error that destroys GP without addressing the structural problem. A second real-world complication is the buying decision feedback loop: a product that requires a 45% clearance markdown to shift was almost certainly over-bought in the first place. The scorecard in this case study explicitly surfaces those situations through a dedicated "Critical — Over-Bought or Misassorted" recommendation flag — treating them as buying signals for the next season's planning cycle, not just pricing problems for the current one.
ER Diagram
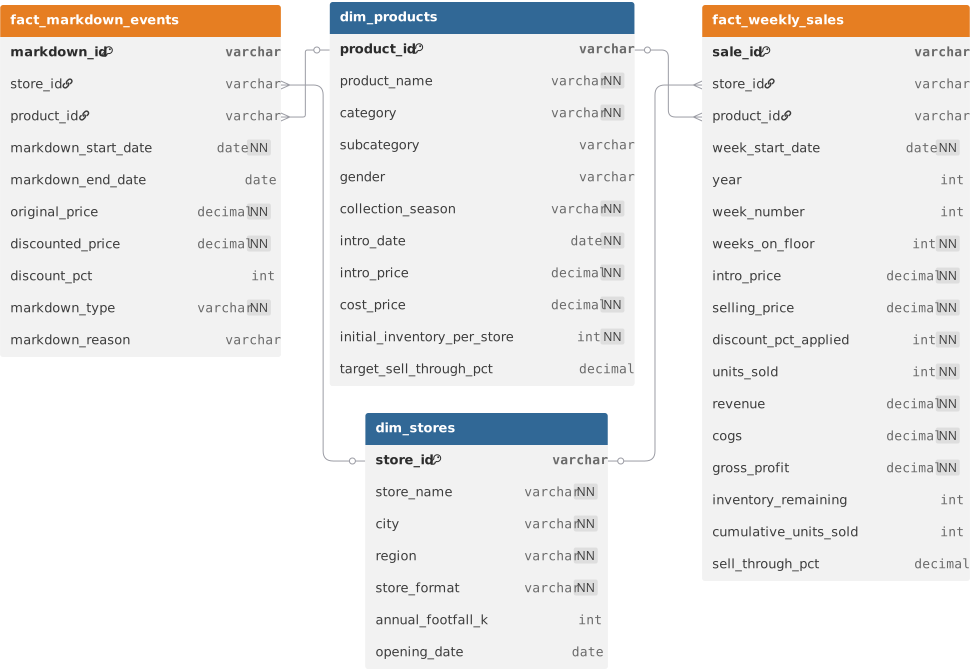
Loading the interactive workspace...