ShopNest: Customer Churn & Retention Analysis
Your best customers are going quiet — do you know who they are?
Problem Statement
ShopNest is a mid-sized direct-to-consumer e-commerce platform operating across six product categories — Electronics, Fashion, Home & Kitchen, Beauty & Personal Care, Sports & Fitness, and Books & Stationery. Over the past four years, ShopNest has steadily grown its registered customer base to approximately 1,500 customers and processed over 20,000 orders across major Indian cities. Acquisition metrics have looked healthy: new customer signups are consistent, social campaigns are performing, and average order values have held steady. Yet the Head of Growth has flagged a troubling pattern — despite these positive signals, total revenue growth has flattened over the last two quarters, and the repeat purchase rate is declining. The working hypothesis is that a significant portion of previously active customers have quietly stopped buying, creating an invisible drain on the business that acquisition spend cannot compensate for.
An internal review suggests that somewhere between 35–45% of customers acquired before mid-2024 have not placed a single order in the past six months — but this has never been formally measured or validated. ShopNest's leadership needs clarity: Who has churned? What does their purchase history look like compared to active customers? And are there patterns — by city, product category, or purchase behavior — that can help the retention team prioritise their outreach? You have been engaged as a data analyst with access to ShopNest's complete transaction history from January 2022 through December 2025. Your task is to deliver a descriptive and diagnostic analysis that answers these questions clearly and concisely, using the company's own data. The output will directly inform the Q1 2026 customer retention campaign, including which segments to target, what messaging angles to use, and where to focus the most effort.
Stakeholder Requirements
-
Churn Segmentation: Define customer churn as no delivered order in the past 180 days (reference date: 31 December 2025). Classify all customers as Active (≤ 90 days since last order), At-Risk (91–180 days), or Churned (> 180 days or no delivered orders). Report the count and percentage for each segment.
-
Behavioral Comparison: For each churn segment, calculate the average number of orders placed and the average order value. The goal is to quantify how Active, At-Risk, and Churned customers differ in their historical purchase behavior.
-
Dimensional Patterns: Identify the top 3 product categories and top 3 cities with the highest concentration of churned customers. Present findings as ranked tables with churned customer counts.
Domain Understanding
E-Commerce Customer Lifecycle
E-commerce businesses face a fundamentally different retention challenge compared to subscription services: customers can disappear without ever formally cancelling anything. There is no cancellation event to capture, no clear departure signal — just gradually increasing silence. The customer purchase lifecycle in e-commerce typically follows a funnel from acquisition → first purchase → repeat purchase → loyal buyer, and most businesses lose 60–70% of first-time buyers before they ever make a second purchase. This makes the transition from one-time buyer to repeat customer one of the most critical inflection points in the business. The key challenge for analysts is that churn is a lagging signal — by the time you can confirm someone has churned, weeks or months have already passed. This is why recency-based analysis is widely used: it lets teams identify customers who are showing early signs of disengagement (at-risk) before they cross the point of no return.
Critical Metrics & Calculations
Five metrics are central to churn and retention analysis in e-commerce:
-
Recency (R): Days since a customer's last delivered order, measured from a fixed reference date. Formula:
Recency = Reference Date − Last Order Date. Lower recency = more recently active = lower churn risk. -
Frequency (F): Total number of delivered orders placed by a customer over the analysis period. Formula:
Frequency = COUNT(order_id) per customer_id. Higher frequency indicates a more engaged customer. -
Average Order Value (AOV): Mean spend per transaction for a given customer. Formula:
AOV = SUM(order_value) / COUNT(order_id). Helps distinguish high-value churned customers who merit personalised win-back effort. -
Customer Churn Rate: Percentage of customers classified as churned within the total customer base. Formula:
Churn Rate = (Churned Customers / Total Customers) × 100. A churn rate above 35% in a 4-year-old customer base typically signals a retention problem worth addressing urgently. -
Customer Lifetime Value (CLV): Estimated total revenue a customer generates over their relationship with the business. Simplified formula:
CLV = AOV × Frequency × Average Customer Lifespan (in years). CLV helps prioritise which churned customers are worth the cost of a win-back campaign.
Business Logic & Trade-offs
The definition of "churn" in e-commerce is not universal — it depends entirely on the typical purchase cadence of the business. A daily grocery platform might define churn as 14 days of inactivity, while a furniture retailer might use 18 months. For a general-purpose e-commerce platform like ShopNest, 180 days (six months) is a widely accepted threshold that balances sensitivity (catching genuine disengagement) without over-flagging seasonal pauses. One important business rule: only delivered orders should count as genuine customer activity. Cancelled and returned orders indicate a failed transaction — they should not be used to reset a customer's recency clock. A customer who placed an order last week but had it cancelled is, for analytical purposes, as inactive as someone who hasn't ordered at all. Another critical trade-off: cities and categories with small customer bases can show misleadingly high churn rates due to small sample sizes. When ranking dimensions by churn concentration, always check absolute counts alongside percentages to avoid drawing conclusions from a handful of customers.
ER Diagram
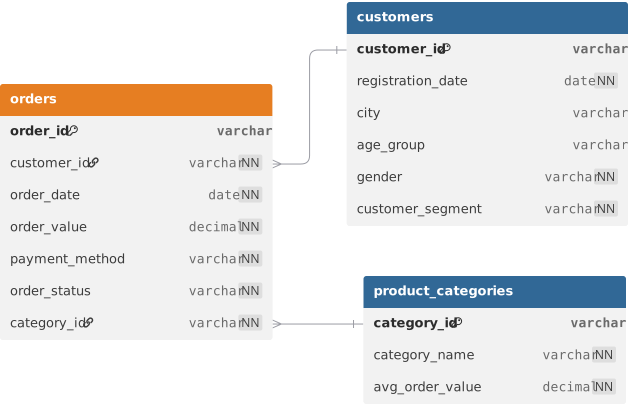
Loading the interactive workspace...