Retain or Lose: Predicting Customer Churn with Logistic Regression
Who's about to abandon your store forever?
Problem Statement
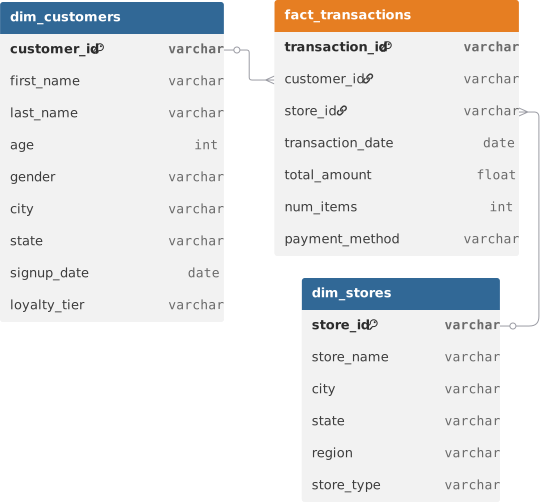
NovaMart is a mid-sized retail chain operating 20 stores across four US regions — North, South, East, and West. Launched in 2019, NovaMart has built a loyal customer base through its tiered loyalty program (Bronze, Silver, Gold) and competitive everyday pricing on grocery and household staples. With nearly 1,800 registered loyalty members and approximately 40,000 transactions logged since January 2023, the business has seen steady top-line growth. However, over the past two quarters, the retention team has flagged a troubling trend: a measurable segment of previously active shoppers has gone silent. These customers — some of whom transacted consistently for 12 to 18 months — have simply stopped showing up, with no complaint, no cancellation, and no feedback. The marketing department's current response is a monthly blanket email campaign, but it targets all customers indiscriminately, wasting budget on both loyal shoppers who don't need re-engagement and already-lost customers who are unlikely to return. The business needs a smarter, more surgical approach.
You have been brought in as a data analyst to build NovaMart's first customer churn prediction model. Using transaction history from January 2023 through June 2025 as your feature engineering window, your job is to identify which customers are at risk of churning — defined as making no purchase between July 1, 2025, and December 31, 2025. You will engineer customer-level behavioral features (recency, frequency, spend), train a logistic regression classifier, handle the natural class imbalance between churned and active customers, evaluate your model using AUC-ROC, and deliver an interpretable, actionable list of at-risk customers for the retention team to act on. This is a predictive analytics task — the output will directly inform NovaMart's re-engagement campaign spend and targeting strategy.
Stakeholder Requirements
--Build a logistic regression model that predicts customer churn using behavioral features (recency, frequency, monetary value, and loyalty tier), and evaluate its performance using the AUC-ROC metric — the model must achieve an AUC above 0.75 to be considered actionable.
--Apply an appropriate class imbalance handling technique and explain how it improves model performance compared to the baseline, then produce a ranked list of the top 50 highest-risk customers for the retention team to target first.
--Interpret the logistic regression coefficients to identify which behavioral features are the strongest predictors of churn, and translate those findings into at least two concrete business recommendations NovaMart's retention team can act on immediately.
Domain Understanding
Retail Industry Overview
Retail is one of the most data-rich industries in the world, yet one of the hardest to retain customers in. Unlike subscription-based businesses where churn is a clear event (account cancellation), retail churn is behavioral — a customer simply stops returning, often with no explicit signal. This makes defining and detecting churn a fundamentally different challenge. Retail businesses operate on thin margins (typically 2–5% net margin for grocery and general merchandise), which means the cost of customer acquisition is high relative to the value of any single transaction. Retaining an existing customer is typically 5–7x cheaper than acquiring a new one, making churn prediction one of the highest-ROI analytical applications in the domain. Loyalty programs — like NovaMart's Bronze/Silver/Gold tiers — are the primary mechanism for tracking customer behavior over time, and the transaction history they generate is the foundation for any retention-focused data science work.
Critical Metrics and Calculations
Four metrics are central to retail churn analysis:
Recency = Number of days between a customer's most recent transaction and the observation cutoff date. Formula: recency = (cutoff_date - last_transaction_date).days. Higher recency means the customer hasn't shopped recently — a strong churn signal. A customer with 180+ days since their last visit is far more likely to have churned than one with 20 days.
Frequency = Total number of transactions a customer made within the observation window. Formula: frequency = COUNT(transaction_id) WHERE customer_id = X. Higher frequency indicates stronger engagement and loyalty. Low-frequency customers (1–3 transactions over 18 months) are typically high-risk.
Monetary Value = Total spend by a customer across the observation window. Formula: monetary = SUM(total_amount) WHERE customer_id = X. While high spenders are not immune to churn, monetary value helps segment churn risk — a high-value churned customer represents a much bigger business loss than a low-value one.
Average Basket Size = Average spend per transaction. Formula: avg_basket = monetary / frequency. This captures shopping behavior independent of visit frequency. A declining average basket can be an early signal of disengagement before full churn occurs.
Together, these four metrics form the foundation of RFM analysis — one of the most widely used customer analytics frameworks in retail.
Business Logic and Trade-offs
The most important business logic decision in a retail churn model is how to define churn. Unlike SaaS, there is no cancellation event. The most common approach is a time-based definition: a customer is considered churned if they have made no purchase within a defined window (commonly 60–180 days, depending on the purchase cycle). For a weekly-grocery-style retailer, 60 days without a purchase may signal churn; for a furniture retailer, 18 months might be normal. NovaMart's 180-day churn window (July–December 2025) is reasonable for a general merchandise retailer with a ~3-week average purchase cycle.
A key trade-off is precision vs. recall. A model that flags every customer as high-risk will catch all churners (high recall) but waste retention budget on customers who were never leaving (low precision). A model that is too conservative will miss real churners. For NovaMart's use case — where the cost of a retention offer is relatively low — a higher-recall model is preferable; it's better to over-spend slightly on re-engagement than to let a genuine churner walk away. This is why AUC-ROC is the right evaluation metric here: it evaluates the model's ability to rank customers by churn risk across all possible thresholds, rather than committing to a single cutoff. Finally, retail churn data is almost always imbalanced — in a healthy business, most customers are active, so churned customers are the minority class. Failing to account for this leads to models that predict "active" for everyone and still score 75% accuracy while being completely useless.
ER Diagram
Loading the interactive workspace...