Reduce Customer Attrition: Behavioral Segment Analysis
Which customers are quietly walking out the door?
Problem Statement
NorthBridge Community Bank is a mid-sized retail bank operating across 25 branches in the southern United States, serving approximately 900 active and recently churned customers across checking, savings, credit card, and money market accounts. Over the past 18 months, the retail banking leadership team has noticed a troubling pattern: a steady stream of customers closing accounts or going completely inactive — without any prior complaints or explicit feedback. The bank's internal estimates suggest an 18% historical churn rate, a figure that sits well above the industry benchmark of 10–12% for community banks of comparable size. What makes the problem harder is that these departures are "quiet churns" — customers simply stop transacting, let balances drain to near-zero, and eventually close their accounts or never return. Meanwhile, the competition from neobanks and digital-first financial services platforms is intensifying, particularly among younger account holders.
You have been commissioned as the analytics team lead to conduct a diagnostic investigation into customer attrition patterns. The bank's data infrastructure provides three key datasets: a customer master file with demographics and churn labels, an accounts table with balance and product information, and a full transaction history spanning January 2023 to June 2025. Your task is descriptive and diagnostic in nature — you are not building a predictive model, but rather identifying which customer segments are most at risk, what behavioral signals precede attrition, and what concrete actions the retention team should prioritize first. Your final output should be a clear, evidence-backed set of risk segment profiles and corresponding retention recommendations that the Head of Retail Banking can present to the board in three weeks.
Stakeholder Requirements
--Quantify the class imbalance problem: Calculate the overall churn rate and the active-to-churned customer ratio. Explain in plain language why analyzing attrition by raw count alone would lead to misleading conclusions, and demonstrate the correct approach using churn rates by segment.
--Profile churned vs retained customers: Compare the two groups across at least four dimensions — age group, customer segment (Mass / Affluent / Premium), number of products held, and key behavioral metrics derived from transaction data (recency, frequency). Identify which profile characteristics show the strongest separation between churned and retained groups.
--Identify the top 3 high-risk active customer segments: Using a combination of demographic, relationship depth, and behavioral features, define and size three distinct at-risk groups within the current active customer base. For each segment, state the estimated count, average balance, and a specific retention action the bank should consider.
Domain Understanding
The Retail Banking Landscape
Retail banking is one of the most data-rich industries in the world, yet customer attrition remains a persistent and costly challenge. Unlike e-commerce churn — where a customer simply stops buying — banking churn is often invisible until it's complete. Customers rarely announce their intention to leave; instead, they reduce transaction frequency, move their primary direct deposit to a competitor, let their balance drain, and eventually close the account. The primary competitive threats in recent years have come from neobanks (Chime, SoFi, Ally) and embedded finance platforms that offer zero-fee checking, high-yield savings, and instant account setup — all of which are particularly attractive to younger, digitally native customers. For a community bank like NorthBridge, the key operational levers are relationship depth (how many products a customer holds), engagement frequency (how actively they transact), and balance stickiness (whether the bank is a customer's primary financial institution). Analysts working in retail banking must understand that a customer with three products and a high average balance represents fundamentally different retention economics than a customer with one dormant checking account.
Critical Metrics and Calculations
The following metrics are foundational to any retail banking attrition analysis:
Churn Rate = Churned Customers / Total Customers — Measures what proportion of the customer base has left within a defined period. For NorthBridge, this is calculated at the customer level using the churn_flag field. Industry benchmarks for community retail banks range from 10–15%; rates above 18% signal a structural retention problem.
Class Imbalance Ratio = Active Customers / Churned Customers — Indicates how disproportionate the two classes are. A ratio of 4.5:1 (as seen in NorthBridge's data) means 82% of the base is active. This creates an analytical trap: a model or count-based analysis that ignores imbalance will dramatically understate the churn risk in minority segments.
Product Penetration = Unique Account Types per Customer — A proxy for relationship depth. Research consistently shows that customers with 2+ products churn at significantly lower rates. Checking-only customers are the highest-risk segment.
Recency of Engagement = Days Since Last Transaction — One of the strongest behavioral leading indicators of churn. A customer who hasn't transacted in 90+ days is a material retention risk. Calculated as (Analysis Date - Last Transaction Date).days.
Transaction Frequency = Total Transactions / Active Months — Measures normalized engagement over the relationship lifetime. Declining frequency before an observed churn event is a common pattern in banking behavioral data.
Business Logic and Trade-offs
A critical nuance in banking attrition analysis is the difference between involuntary and voluntary churn. Involuntary churn (account closures due to fraud, regulatory action, or bank-initiated decisions) requires different treatment than voluntary churn driven by customer preference — and the two are often mixed in raw data. For this case study, the data reflects voluntary attrition only. Another important trade-off is the distinction between a customer's total balance and their primary financial institution (PFI) status — a customer may hold $50,000 in a savings account at NorthBridge but do all their daily spending through a Chase checking account, making them appear "valuable" by balance but actually very low in engagement and easy to lose. Analysts must look at both balance and behavioral signals together. Seasonality also affects transaction volumes: tax season (February–April) and holiday season (November–December) drive elevated activity that can mask underlying engagement decline. When measuring recency and frequency, it is best practice to use a rolling 90-day window or compare against the customer's own historical baseline rather than cross-sectional averages alone.
ER Diagram
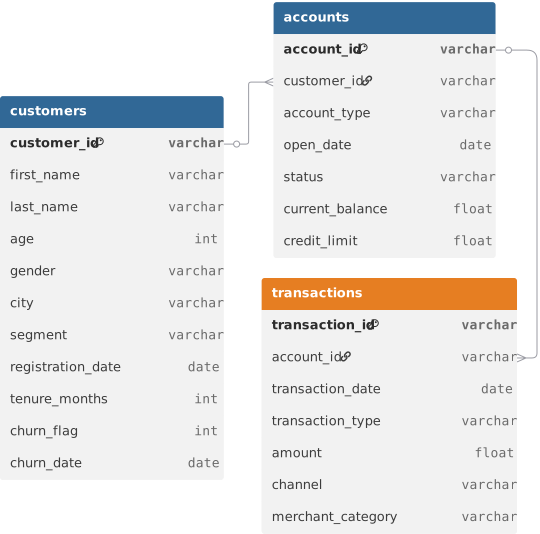
Loading the interactive workspace...