Reduce 30-Day Readmissions: Binary Risk Classification Using Logistic Regression
Hospital Readmission Risk Prediction
Problem Statement
MidState General Hospital is a 520-bed regional medical center serving a mixed urban-suburban population across Central Ohio. Over the past three fiscal years (2022–2025), the hospital has processed over 13,000 inpatient admissions annually — and has been flagged by the Centers for Medicare & Medicaid Services (CMS) for an above-average 30-day readmission rate of 19.4%, compared to the national benchmark of 15.2%. Under the Hospital Readmissions Reduction Program (HRRP), MidState has already absorbed $2.1 million in CMS penalty adjustments, with further reductions scheduled if readmission rates do not improve within the next reporting cycle. The clinical leadership team knows the problem exists — but without a data-driven risk model, the care transition team has no systematic way to identify which discharged patients are most likely to return within 30 days.
The VP of Clinical Quality, Dr. James Okafor, has partnered with the hospital's analytics team to build a 30-day readmission risk prediction model. The goal is to score every patient at the point of discharge: high-risk patients will be enrolled in MidState's Transitional Care Program (TCP), which includes a 48-hour post-discharge phone call, a 7-day follow-up appointment, and medication reconciliation support. This targeted intervention costs approximately $380 per patient — far less than the average $14,200 cost of a preventable readmission. As the data analyst assigned to this project, you will engineer features from admission records, discharge details, and lab results, train a Logistic Regression classifier, evaluate it using AUC-ROC, and identify the top clinical and operational risk factors driving early readmissions. Your model will directly inform which patients receive intensive post-discharge support starting next quarter.
Stakeholder Requirements
-
Train a Logistic Regression model to predict 30-day readmission (binary: 0/1) using engineered features from patient demographics, admission history, discharge disposition, and lab values; report model performance using AUC-ROC score and a confusion matrix on a held-out test set, and confirm the model outperforms a naïve baseline that predicts the majority class for all patients.
-
Generate a feature importance analysis using the model's coefficients — identify and visualize the top 8 risk factors driving predicted readmission, and explain the clinical interpretation of the two strongest predictors in plain language suitable for Dr. Okafor's clinical team.
-
Produce a risk-scored discharge summary: append a predicted readmission probability to each admission record in the test set, flag patients above a chosen probability threshold as "High Risk — Enroll in TCP," and report the number of patients the model would route to the Transitional Care Program under that threshold.
Domain Understanding
Paragraph 1 — Hospital Readmissions and the Regulatory Landscape
A 30-day readmission occurs when a patient discharged from a hospital is re-admitted to any acute care facility within 30 days of their original discharge date. The Hospital Readmissions Reduction Program (HRRP), established under the Affordable Care Act, penalizes hospitals with excess readmission rates across six priority conditions: heart failure, pneumonia, acute myocardial infarction (heart attack), COPD, hip/knee arthroplasty, and coronary artery bypass grafting. In practice, hospitals track all-cause 30-day readmissions because patients with multiple chronic conditions rarely present with a single clean diagnosis. The key operational challenge for analysts is this: readmission risk prediction must happen at discharge, not in hindsight. This means all features in the model must be values that are knowable at the moment the patient leaves — not outcomes observed later. Discharge disposition (whether a patient goes home, to a rehab facility, or to a nursing home), length of stay, and final lab values are all knowable at discharge. Post-discharge events are not. Getting this temporal boundary right is one of the most common mistakes analysts make when building readmission models.
Paragraph 2 — Critical Metrics & Calculations
Five metrics are central to readmission risk modeling and clinical interpretation:
AUC-ROC (Area Under the Receiver Operating Characteristic Curve): AUC = ∫ TPR d(FPR) across all classification thresholds. An AUC of 0.5 is no better than random; 0.7–0.8 is considered acceptable for clinical risk models; above 0.8 is strong. Most published 30-day readmission models achieve AUC between 0.68 and 0.78 using administrative data — your model should land in this range.
Length of Stay (LOS): LOS = Discharge Date − Admission Date in whole days. Longer LOS is consistently one of the strongest predictors of readmission, reflecting higher illness severity. However, very long stays also reflect planned complex care (surgical recovery), so LOS is a signal requiring clinical context.
Prior Admission Count (12-month rolling): Count of admissions for the same patient in the 12 months preceding the current admission. Patients with 2+ prior admissions have 2–3× higher readmission risk than first-time admits. This is one of the most powerful engineered features in readmission models.
Creatinine (kidney function marker): Measured in mg/dL; normal range is 0.7–1.3 mg/dL. Elevated creatinine at discharge (>1.5 mg/dL) is a strong predictor of 30-day readmission, particularly for heart failure and diabetes patients, because it signals that the underlying condition has not been adequately resolved.
Elixhauser Comorbidity Score: A weighted count of up to 31 comorbid conditions present at admission, each assigned a different risk weight. In this case study, we approximate it as a count of active chronic conditions, which correlates closely with the full Elixhauser score and is far simpler to compute from available data.
Paragraph 3 — Business Logic & Trade-offs
The most critical design decision in a readmission model is threshold selection — converting the model's continuous probability output into a binary "High Risk / Low Risk" classification. A lower threshold (e.g., 0.25) catches more true readmissions (high recall) but also flags many patients who won't actually be readmitted (low precision), overloading the care transition team. A higher threshold (e.g., 0.50) is more precise but misses patients who need intervention. In practice, clinical teams anchor this decision on the cost ratio: if a false negative (missed readmission) costs $14,200 and a false positive (unnecessary intervention) costs $380, the threshold should be set so that recall is prioritized over precision — typically in the 0.25–0.35 range for readmission programs.
A second important consideration is class imbalance: only 18–22% of hospital admissions result in a 30-day readmission in most community hospital settings. This means a naïve model that predicts "no readmission" for every patient achieves 80% accuracy but provides no clinical value whatsoever. This is why AUC-ROC — which evaluates model performance across all thresholds — is the correct primary metric, not accuracy. Logistic Regression handles mild class imbalance reasonably well, but analysts should check whether using class_weight='balanced' in sklearn improves AUC on imbalanced targets. Finally, be aware that multicollinearity between features (e.g., creatinine and number of chronic conditions are both proxies for illness severity) can make individual coefficients harder to interpret — but does not affect the model's predictive power.
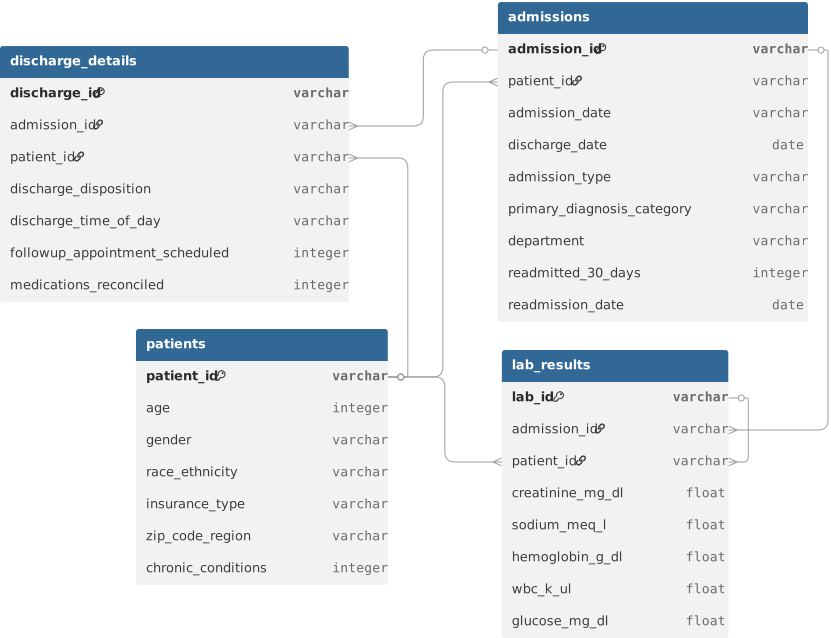
ER Diagram
Loading the interactive workspace...