Red Flags in the Books: Detecting Procurement Fraud Using Isolation Forest
The vendor passed every audit — until the algorithm looked closer.
Problem Statement
NorthGate Manufacturing Group is a multinational industrial manufacturer headquartered in Detroit, with procurement operations spanning 8 regional offices across North America. Over the three-year period from January 2023 through December 2025, NorthGate's procurement department processed approximately 27,000 purchase orders covering raw materials, contract services, maintenance supplies, and capital equipment — sourced from a vendor base of over 200 registered suppliers.
An internal audit review triggered by a whistleblower report in Q3 2025 found evidence of a procurement fraud scheme involving a small number of vendors and purchasing agents. The scheme exploited three known vulnerabilities in NorthGate's approval process: invoice splitting (breaking large orders into multiple sub-threshold invoices to avoid senior approval), round-number bidding (submitting invoices with suspiciously round amounts suggesting estimates rather than real cost calculations), and threshold manipulation (consistently submitting POs just below the $50,000 approval threshold to avoid CFO sign-off). Across 27,000 transactions, only a small fraction showed these patterns — making manual detection impractical.
You have been brought in by NorthGate's Head of Internal Audit to build a data-driven anomaly detection system. Using Isolation Forest, you will engineer procurement-specific fraud-signal features from raw PO data, assign an anomaly score to every purchase order, rank vendors by aggregate risk, and produce a tiered watchlist — High / Medium / Low risk — that the audit team will use to prioritise their investigation. Unlike supervised classification, this approach requires no labeled fraud examples — it identifies structurally abnormal transactions by how different they are from the bulk of the procurement population.
Stakeholder Requirements
--Engineer at least 6 fraud-signal features from raw PO data — including round-number flag, just-below-threshold flag, weekend submission flag, vendor invoice frequency (orders per vendor per month), PO amount deviation from vendor historical average, and days between PO submission and invoice date. Validate each feature by showing its distribution differs meaningfully between high-anomaly-score and low-anomaly-score transactions.
--Train an Isolation Forest model (contamination = 0.05) on the engineered feature set, assign an anomaly score to every PO, and produce a risk-tiered output: High Risk (top 5% anomaly scores), Medium Risk (next 10%), Low Risk (remainder). Plot the anomaly score distribution and highlight the tier thresholds.
--Build a Vendor Risk Leaderboard — aggregate anomaly scores at the vendor level, rank vendors by average anomaly score and High-Risk PO count, and present the top 20 vendors for audit prioritisation. Provide a one-paragraph written interpretation identifying the most common fraud pattern combinations found in high-risk transactions.
Domain Understanding
Procurement Fraud: How It Works and Why It's Hard to Catch
Procurement fraud is one of the most common and costly forms of corporate financial crime, accounting for an estimated 40% of all occupational fraud cases according to industry research. It exploits the structural complexity of procurement processes — multiple approval layers, large vendor bases, high transaction volumes, and the routine nature of PO-based purchasing — to hide fraudulent transactions in plain sight. The most prevalent schemes in manufacturing and industrial procurement include: invoice splitting (dividing a single large purchase into multiple smaller invoices to stay below approval thresholds, each appearing routine individually); threshold manipulation (consistently pricing invoices just below approval limits — e.g., $49,500, $49,800 — to avoid escalation to a higher authority with more scrutiny); round-number invoicing (submitting invoices with suspiciously round amounts like $25,000 or $50,000 that suggest fabricated rather than market-cost calculations); and fictitious or collusive vendors (creating shell companies or colluding with real vendors to submit inflated or fictitious invoices). What makes these patterns detectable by Isolation Forest is that they create statistical anomalies — transactions that deviate meaningfully from the bulk of normal procurement behaviour — even when no individual transaction exceeds a policy limit.
Critical Metrics & Calculations
Six metrics define both the fraud-signal features and the model output:
1. Round-Number Flag
is_round_number = 1 if (po_amount % 1000 == 0 or po_amount % 500 == 0) else 0
Legitimate supplier invoices are based on real cost calculations — unit prices, quantities, shipping, taxes — and almost never land on exact multiples of 500 or 1000. A high concentration of round-number amounts within a vendor's PO history is a classic fabrication signal.
2. Just-Below-Threshold Flag
is_below_threshold = 1 if 45000 <= po_amount < 50000 else 0
The $45,000–$49,999 band requires only manager approval at NorthGate. A vendor or purchasing agent deliberately keeping amounts in this band, repeatedly, is a threshold-manipulation signal invisible in any individual transaction but visible at the vendor level.
3. Vendor Invoice Frequency (monthly)
vendor_monthly_freq = count of POs for this vendor in the same calendar month
A vendor suddenly submitting 15 invoices in a month when their historical average is 2 is a classic invoice-splitting signal. Frequency spikes within a short window are among the strongest anomaly drivers.
4. PO Amount Deviation from Vendor Historical Average
amount_deviation_zscore = (po_amount - vendor_mean) / vendor_std
A z-score of the PO amount within that vendor's own historical distribution. A deviation > 3 means the amount is more than 3 standard deviations from what this vendor normally charges — a strong outlier signal.
5. Days Between PO Submission and Invoice Date
po_to_invoice_days = (invoice_date - po_date).days
Very short gaps (< 2 days) may indicate a pre-arranged invoice — the vendor submitted the invoice before work was done. Very long gaps may indicate backdated POs covering retroactive spending.
6. Anomaly Score (Isolation Forest)
anomaly_score = -model.decision_function(X)
Isolation Forest returns a decision function where lower values indicate more anomalous observations. Negating it produces an intuitive score where higher = more anomalous. A score above the 95th percentile defines High Risk.
Business Logic & Trade-offs
The key operational trade-off in anomaly detection for fraud is between sensitivity (catching more fraud, but generating more false positives) and specificity (fewer false alarms, but potentially missing real fraud). The contamination parameter in Isolation Forest directly controls this: setting contamination=0.05 tells the model to treat the top 5% of transactions as anomalies — roughly 1,350 POs in a 27,000-row dataset. At NorthGate, with a 4-person audit team, reviewing 1,350 transactions over a quarter is feasible; reviewing 2,700 (10% contamination) would not be. This is why the contamination parameter is a business decision informed by audit capacity, not purely a statistical one.
A second important principle is that anomaly score alone does not prove fraud. High-risk transactions may be anomalous for entirely legitimate reasons — an emergency capital purchase, a one-time specialised service contract, a seasonal bulk order. The anomaly score's purpose is to rank and prioritise the audit team's investigation, not to classify transactions as fraudulent. The distinction between "anomalous" and "fraudulent" is what a skilled analyst must communicate clearly to non-technical audit stakeholders — the model finds needles worth examining; the auditor decides whether each needle is a nail or a pin.
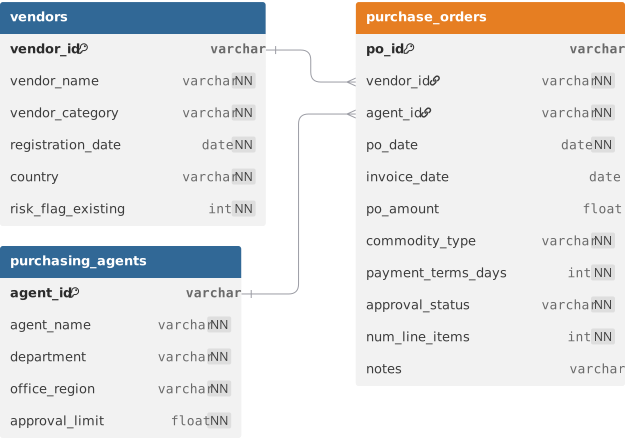
ER Diagram
Loading the interactive workspace...