PrimeCart: Customer Lifetime Value Analysis
Who are your best customers — and are you treating them that way?
Problem Statement
PrimeCart is a fast-growing direct-to-consumer e-commerce platform serving customers across seven major Indian cities. Operating across five product categories — Electronics, Fashion, Home & Living, Health & Beauty, and Sports & Outdoor — PrimeCart has grown its customer base to over 1,800 registered users and processed more than 30,000 orders between January 2022 and December 2025. On the surface, the business looks healthy: revenue is growing year on year, and new customer acquisition has been consistent. But the Chief Revenue Officer has raised an uncomfortable question in the last two board reviews: is PrimeCart investing its retention budget wisely?
Currently, all customers receive the same promotional emails, the same discount offers, and the same customer service priority — regardless of how much they actually spend. The hypothesis is that a small segment of customers is generating a disproportionate share of total revenue, while a large base of low-frequency buyers receives the same treatment despite contributing far less. Without a formal Customer Lifetime Value (LTV) framework, the retention team is flying blind — spending equally on customers whose long-term value differs by an order of magnitude. You have been brought in as a data analyst to build PrimeCart's first LTV analysis using four years of transaction history. Your task is descriptive and diagnostic: calculate the historical revenue each customer has generated, estimate their projected LTV using a simple formula-based approach, and segment the customer base into meaningful LTV tiers. The findings will directly inform how PrimeCart allocates its Q1 2026 retention and loyalty budget across customer segments.
Stakeholder Requirements
-Historical & Projected LTV Calculation: For each customer, compute their total historical revenue from delivered orders. Then estimate their Projected LTV using the formula: Projected LTV = Average Order Value × Annual Purchase Frequency × 3-year horizon. Annual Purchase Frequency is defined as total delivered orders divided by the number of years the customer has been active (minimum 0.5 years to avoid division edge cases).
-LTV Tier Segmentation: Classify all customers into three tiers based on their Projected LTV — High Value (top 20%), Medium Value (middle 50%), and Low Value (bottom 30%). Report the count, average LTV, and total revenue contribution of each tier. Verify whether the Pareto principle holds: do the top 20% of customers generate at least 50% of total revenue?
-Dimensional Patterns: For each LTV tier, identify the most common product category (by order count) and the most common city. Present findings as a structured comparison table. The goal is to understand whether High Value customers cluster around specific categories or geographies that the retention team should prioritise.
Domain Understanding
Customer Lifetime Value in E-Commerce
Customer Lifetime Value is one of the most strategically important metrics in any direct-to-consumer business, yet it is surprisingly underused by early-to-mid stage e-commerce companies. The core idea is simple: not all customers are equal, and understanding the long-term revenue potential of each customer enables businesses to allocate retention, marketing, and service resources proportionally. In practice, LTV analysis powers several critical decisions — how much to spend acquiring a new customer (Customer Acquisition Cost should be a fraction of expected LTV), which customers to prioritise in win-back campaigns, how to design tiered loyalty programmes, and even which product categories to expand. The challenge is that LTV is inherently forward-looking — it requires estimating future behaviour from historical patterns. At the analysis level covered in this case study, a formula-based approach using historical purchase metrics is standard practice and widely used by analytics teams at mid-sized e-commerce platforms.
Critical Metrics & Calculations
Five metrics form the foundation of LTV analysis:
-
Historical LTV: The actual total revenue generated by a customer from all delivered orders to date. Formula:
Historical LTV = SUM(order_value) for delivered orders per customer. This is a factual measure — no estimation needed. -
Average Order Value (AOV): Mean revenue per delivered order for a given customer. Formula:
AOV = Historical LTV / Total Delivered Orders. Higher AOV customers generate more revenue per transaction, making them naturally more valuable. -
Annual Purchase Frequency: How many orders a customer places per year, based on their active history. Formula:
Annual Frequency = Total Delivered Orders / Years Active, whereYears Active = (Last Order Date − First Order Date).days / 365, with a minimum floor of 0.5 years. This prevents artificially inflated frequency scores for brand-new customers. -
Projected LTV (3-Year): An estimated forward-looking value assuming the customer continues purchasing at their current rate for three more years. Formula:
Projected LTV = AOV × Annual Frequency × 3. This is a simplified but widely-used formula in retail analytics. More advanced versions incorporate discount rates and churn probability, but this formulation is the right starting point. -
Revenue Concentration (Pareto Check): The percentage of total revenue generated by the top 20% of customers by Projected LTV. Formula:
Top 20% Revenue Share = Revenue from top 20% customers / Total Revenue × 100. In most healthy e-commerce businesses, this figure sits between 55–75%, reflecting the well-known Pareto principle in customer value distributions.
Business Logic & Trade-offs
One important nuance in LTV analysis is the difference between a customer who is high value but churned versus one who is high value and active. A customer with ₹80,000 in historical LTV who last ordered three years ago has very different strategic implications compared to one who ordered last month. A complete LTV framework should account for recency — but for a Level-3 analysis, computing and segmenting Projected LTV based on historical behaviour is the right scope. Another critical consideration is that only delivered orders should be included in LTV calculations. Cancelled and returned orders represent failed transactions — including them would inflate LTV figures and misrepresent a customer's true value to the business. Additionally, when comparing LTV across product categories, be mindful of inherent price differences: an Electronics customer will naturally have a higher AOV than a Fashion customer, so category comparisons should focus on frequency and tier distribution rather than raw LTV numbers alone.
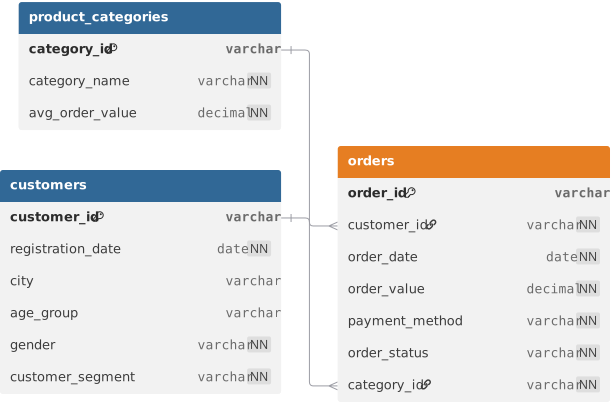
ER Diagram
Loading the interactive workspace...