Prevent Stockouts Before They Happen: Weekly Replenishment Demand Forecasting
Which SKUs will run out before next week's delivery arrives?
Problem Statement
BrightBasket Retail Group is a regional grocery and FMCG retailer operating 12 stores across three geographic regions — North, South, and East. Over the past quarter, the supply chain team has noticed a troubling pattern: stockout rates have climbed to approximately 12% across high-velocity categories like beverages and dairy. That means roughly 1 in 8 times a customer reaches for a product, the shelf is empty. Store managers are filing weekly complaints about gaps in the beverage aisle during summer and dairy shortages heading into the holiday season, yet the replenishment orders being sent to suppliers haven't meaningfully changed in over two years.
The root of the problem is BrightBasket's current replenishment system: a fixed reorder point model set when each store first opened. These static triggers were never designed to account for seasonal demand swings, annual sales growth, promotional uplift, or the significant difference in velocity between a Large Superstore and a Small Express outlet. The result is a system that treats every week of the year the same and every store the same — and real-world retail doesn't work that way. The replenishment team is placing orders based on intuition and last-minute urgency rather than forward-looking demand signals, leading to both stockouts (lost revenue, damaged customer trust) and occasional over-ordering (wasted shelf space, tied-up working capital).
Your goal is to produce a rolling demand forecast for the next replenishment cycle, identify which store-SKU combinations are genuinely at risk of stocking out before the next delivery, and generate a prioritised replenishment recommendation report for the supply chain team to act on before end of week.
This is a diagnostic + prescriptive analysis. You are not just describing what happened historically — you are diagnosing which parts of the inventory system are failing right now and prescribing specific replenishment actions. Your final deliverable is a ranked list of at-risk items with quantified order quantities, supported by a rolling average forecast model and a days-of-cover calculation.
Stakeholder Requirements
--Produce a next-week demand forecast for every active store-SKU combination using a rolling average approach, and evaluate its accuracy against recent actuals (back-test MAPE). Clearly explain why rolling averages are more suitable than the current fixed-order system for a business with seasonal demand patterns.
--Identify all store-SKU combinations where current stock levels (after accounting for pending orders) will not last until the next scheduled delivery, classified by urgency tier: Stockout (zero stock now), Critical (< 3 days of cover), and At Risk (days of cover < product lead time). Break down the at-risk rate by both region and product category.
--Generate a prioritized replenishment order table — ranked by urgency — showing each at-risk store-SKU pair, its current days of cover, its forecasted weekly demand, and the recommended order quantity (rounded up to the supplier's minimum order quantity). Include the estimated total order value for the at-risk items.
Domain Understanding
Domain Overview
Grocery and FMCG (Fast-Moving Consumer Goods) retail is defined by high transaction velocity, tight margins, and extremely time-sensitive inventory dynamics. Unlike durable goods retail, FMCG products often have short shelf lives (dairy measured in days, beverages in weeks), which means both stockouts and overstocks have direct cost implications. Retailers operating multi-store networks must balance replenishment across locations with different catchment demographics, store formats, and seasonal exposure — a challenge that grows non-linearly as the number of store-SKU combinations increases. BrightBasket's 12 stores × 35 SKUs yields 420 active combinations to manage weekly, each with its own demand rhythm. In practice, supply chain analysts in FMCG spend a significant portion of their time on this exact problem: translating historical sales patterns into defensible, actionable forward-looking replenishment plans.
Critical Metrics & Calculations
Days of Cover (DoC): DoC = Units on Hand / Average Daily Demand where Average Daily Demand = Forecast Weekly Demand / 7. Days of Cover tells you how long current stock will last at the expected sales rate. A DoC below a product's lead time (days from order to delivery) means the store will stock out before the next delivery arrives — the direct trigger for a replenishment alert.
Reorder Point (ROP): ROP = Average Daily Demand × (Lead Time in Days + Safety Days). The reorder point is the stock level at which a replenishment order should be triggered. In BrightBasket's legacy system, this was set statically. A dynamic system recalculates it continuously based on rolling demand.
Safety Stock: Safety Stock = Z × σ_demand × √Lead Time. Safety stock is a buffer held above the reorder point to absorb demand variability. For Level 4 analysis, a simplified version — Safety Stock = 1.5 × Forecast Weekly Demand — is a practical starting point before advancing to statistical safety stock models.
Mean Absolute Percentage Error (MAPE): MAPE = mean(|Actual - Forecast| / Actual) × 100. MAPE measures forecast accuracy as a percentage. A MAPE of 10–15% is considered acceptable for weekly store-level grocery forecasting; below 10% is strong performance.
Replenishment Order Quantity: Order Qty = max(Target Stock - (On Hand + On Order), 0) rounded up to the supplier's minimum order quantity (MOQ). Target Stock = Forecast Weekly Demand + Safety Stock.
Business Logic & Trade-offs
One of the most important decisions in replenishment forecasting is choosing the right forecast window. A short rolling window (e.g., 4 weeks) is highly responsive to recent demand shifts — great for catching a seasonal ramp-up — but sensitive to noise from one-off events like a promotion or a local weather event. A longer window (8 weeks) smooths out noise but reacts slowly to genuine trend changes. In practice, analysts often use a short window as the primary forecast and the long window as a sanity check, flagging cases where they diverge significantly. A critical complication is promotional demand: if a store ran a promotion in the last 4 weeks, the rolling average will be inflated. BrightBasket's dataset includes a promo_flag field — an analyst who ignores this will systematically over-forecast demand for the weeks following a promotion. Another trade-off to consider is the min order quantity constraint: some products (particularly household goods with a 6-unit MOQ) force the analyst to round up significantly, meaning the true order cost is often higher than the raw replenishment calculation suggests. Finally, be aware that small express stores are disproportionately vulnerable to stockouts simply because they carry smaller absolute inventory volumes — a 2-day demand spike can wipe out their entire stock where a superstore would barely notice it.
ER Diagram
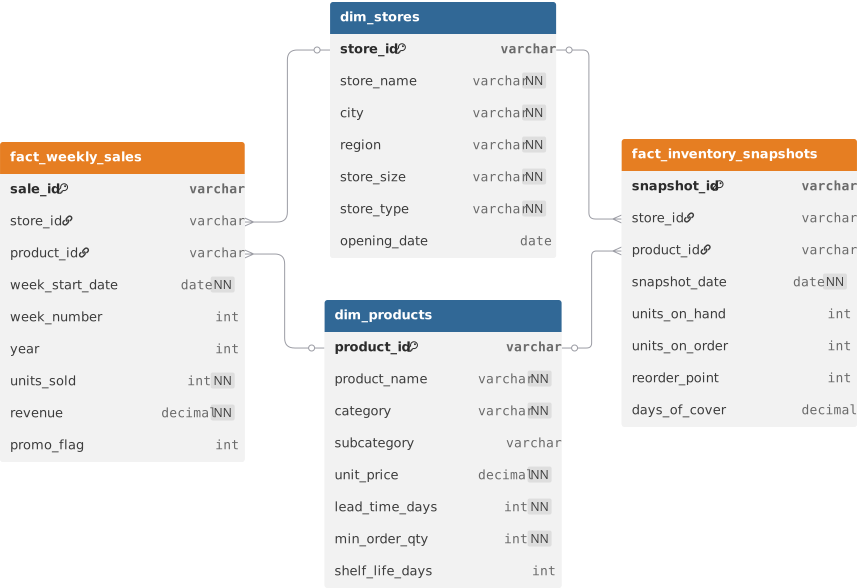
Loading the interactive workspace...