Patient Risk Segmentation Using K-Means Clustering
Patient Segmentation for Population Health
Problem Statement
ClearPath Health Network operates 12 community health clinics across the Midwest, currently serving approximately 9,500 active patients enrolled between 2023 and 2025. Despite a 14% year-over-year increase in preventive care appointments, the network's care management team has flagged a persistent and costly problem: a disproportionate share of emergency room visits and inpatient hospitalizations are coming from patients who had recent clinical encounters — but received no targeted intervention beforehand. In the past fiscal year alone, preventable high-acuity events accounted for an estimated $4.2 million in excess care costs. The root issue is structural: ClearPath currently applies a uniform outreach approach across its entire patient population, sending the same wellness reminders and scheduling the same annual checkups regardless of individual clinical risk.
The Chief Medical Officer, Dr. Sarah Nguyen, has commissioned a population health analysis to transform this one-size-fits-all model. The goal is to use patient clinical measurements and healthcare utilization patterns to segment the patient base into distinct, actionable risk groups. These groups will allow the care coordination team to prioritize high-risk patients for intensive case management, engage moderate-risk patients with targeted chronic disease programs, and maintain efficient routine care for healthy low-risk patients. As the data analyst assigned to this project, you will apply K-Means clustering to ClearPath's patient records — integrating clinical metrics (HbA1c, blood pressure, cholesterol, kidney function) with healthcare utilization data (ER visits, hospitalizations, chronic condition burden, care costs) to produce a segmentation model the clinical team can act on immediately. Your final deliverable is a set of labeled patient segments with descriptive profiles and care coordination recommendations.
Stakeholder Requirements
- Segment ClearPath's patient population into 3–4 meaningful risk groups using K-Means clustering on clinical and utilization features; assign each cluster a descriptive business label (e.g., "High Risk — Complex Care", "Moderate Risk — Managed Chronic", "Low Risk — Healthy") and justify the chosen number of clusters using the elbow method or silhouette scores.
- Produce a PCA-based 2D scatter plot that visually demonstrates cluster separation, and generate a cluster profile summary table showing average values of key health metrics (HbA1c, systolic BP, ER visits, chronic conditions, annual care cost) per segment to guide care coordination resource allocation.
Domain Understanding
Paragraph 1 — Population Health Management Overview
Population health management is the practice of proactively analyzing health outcomes across a defined group of patients to identify risks, close care gaps, and deploy clinical resources efficiently. Unlike episodic care — where a clinician only engages when a patient presents with a complaint — population health takes a longitudinal view: who is trending toward a preventable crisis? Health systems typically segment populations using a combination of clinical indicators (lab values, vital signs), administrative data (diagnoses, visit frequency), and social determinants. The core operational challenge is resource allocation: care coordinators, case managers, and specialist referrals are finite resources. Without data-driven prioritization, high-risk patients often fall through the cracks until they arrive in the emergency room — the most expensive and least effective point of intervention. Analysts in this domain must navigate data from multiple sources (electronic health records, claims data, lab systems) and translate clinical measurements into actionable risk profiles.
Paragraph 2 — Critical Metrics & Calculations
Five clinical and utilization metrics are foundational to patient risk stratification in population health:
HbA1c (Glycated Hemoglobin): HbA1c % reflects average blood glucose over the past 2–3 months. A value below 5.7% is normal; 5.7–6.4% indicates prediabetes; 6.5% and above indicates diabetes. For managed diabetics, a target below 7.0% suggests good control. High HbA1c signals elevated risk for kidney failure, cardiovascular events, and neuropathy — all high-cost downstream conditions.
eGFR (Estimated Glomerular Filtration Rate): eGFR = 141 × min(Scr/κ, 1)^α × max(Scr/κ, 1)^(-1.209) × 0.993^Age (CKD-EPI formula). In practice, it is reported directly by labs. Values above 60 mL/min/1.73m² are considered adequate kidney function; values below 30 indicate serious chronic kidney disease. eGFR decline is a key risk escalation signal.
Systolic Blood Pressure: Measured in mmHg; the upper number in a BP reading. Normal is below 120 mmHg; hypertension stage 1 is 130–139 mmHg; stage 2 is 140+ mmHg. Uncontrolled hypertension is the leading modifiable risk factor for stroke and heart failure.
ER Utilization Rate: ER Visits per Patient per Year. Population averages in community health settings typically run 0.2–0.4 visits per year for low-risk patients. Patients averaging 3+ ER visits annually are strong candidates for intensive care management enrollment.
Annual Care Cost per Patient: Total estimated cost of care in USD per year, including visits, labs, medications, and hospitalizations. Population health programs use this metric to prioritize interventions — reducing per-patient costs for the top 5% of cost drivers often yields outsized system-level savings.
Paragraph 3 — Business Logic & Trade-offs
A critical trade-off in patient segmentation is the tension between sensitivity and specificity in risk identification. Overly aggressive risk thresholds cast a wide net — many patients get flagged as "high risk" who are actually stable, overwhelming care coordinators with false positives. Overly conservative thresholds miss patients who genuinely need intervention. K-Means clustering navigates this by letting the data surface natural groupings rather than imposing arbitrary cutoffs. However, analysts must remember that K-Means optimizes for geometric compactness, not clinical interpretability — two clusters can be mathematically distinct but clinically indistinguishable. Always validate cluster separation with domain knowledge: profile each cluster's average metrics and ask whether a clinician would make meaningfully different care decisions for each group.
A second important consideration is feature scale asymmetry: annual care cost ($400–$30,000) and HbA1c (4.5–12.0) live on completely different numerical scales. Because K-Means is a distance-based algorithm, features with larger numeric ranges will dominate the clustering unless all features are standardized first. Standardization using Z-scores (mean=0, std=1) is non-negotiable before fitting K-Means. Finally, be aware that demographics like age and BMI can act as proxies for protected characteristics — while they are legitimate clinical inputs here, segment-based interventions must be designed to be equitable and not inadvertently disadvantage specific demographic groups.
ER Diagram
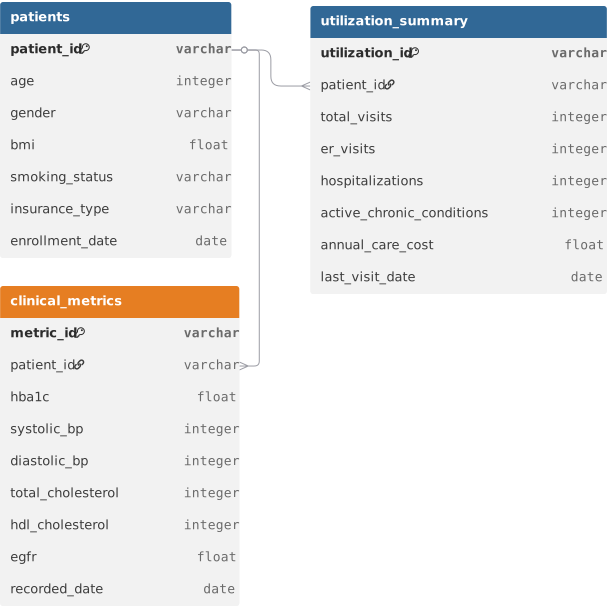
Loading the interactive workspace...