Optimize Staff Scheduling: Weekly Sales Pattern Analysis
When do customers actually shop with us?
Problem Statement
FreshMart Groceries, a mid-sized regional grocery chain operating 8 stores across suburban neighborhoods, is facing a common retail challenge: inefficient staff scheduling. The operations manager, Sarah Chen, has noticed that some days the stores are overwhelmed with customers while staff scramble to keep up, while other days employees stand idle during slow periods.
Over the past 6 months (January through June 2024), FreshMart has processed approximately 4,500 transactions across their network. While overall sales have been steady, Sarah suspects there are clear patterns in when customers prefer to shop—but she doesn't have the data analysis to back up her intuition. Store managers have been scheduling staff based on tradition ("we've always had more people on Fridays") rather than actual customer traffic data.
The stakes are significant: overstaffing costs the company roughly $8,000 per month in unnecessary labor, while understaffing leads to long checkout lines, abandoned carts, and frustrated customers who might shop elsewhere. Sarah needs a data-driven approach to understand weekly shopping patterns so she can optimize shift scheduling, reduce labor costs, and improve customer experience.
Your Role: You've been brought in as a junior data analyst to examine FreshMart's transaction data and uncover the weekly sales patterns. Your analysis will directly inform staffing decisions across all 8 stores, potentially saving thousands in labor costs while keeping customers happy.
Expected Analysis Type: This is a descriptive and diagnostic analysis. You'll be exploring historical transaction data to identify patterns, calculate daily sales volumes, and provide clear recommendations based on observed customer behavior.
Final Deliverable: A clear breakdown of sales by day of week with specific recommendations for optimal staffing levels throughout the week.
Stakeholder Requirements
-
Identify the busiest and slowest days of the week with total sales amounts for each day to understand customer traffic patterns
-
Calculate the percentage of weekly sales that occurs on each day to help Sarah understand the relative importance of each day
-
Provide a clear ranking of days from highest to lowest sales volume to guide staffing priority decisions
Domain Understanding
Understanding Retail Operations
Retail is fundamentally about matching supply (products, staff, store hours) with customer demand. Unlike manufacturing or SaaS businesses where production can be planned weeks in advance, retail operations must respond to real-time customer traffic patterns. The most successful retailers understand that customer shopping behavior follows predictable patterns—daily, weekly, and seasonal—and they optimize their operations around these rhythms.
In grocery retail specifically, staffing represents 15-20% of total operating costs, making it one of the largest controllable expenses. Store managers must balance two competing goals: ensuring enough staff are present during peak times to maintain customer satisfaction (short checkout lines, stocked shelves, available help) while avoiding overstaffing during slow periods that drains profitability. The challenge is that many retailers still schedule staff based on tradition, manager intuition, or simple rules like "weekends are busy" without quantifying actual traffic patterns. This leads to systematic inefficiencies—stores might be perfectly staffed on Saturday but dramatically overstaffed on Tuesday.
Critical Metrics in Retail Analytics
Daily Sales Volume = Sum of all transaction amounts for a given day. This is the most fundamental metric in retail—it tells you how much revenue the business generated on any particular day. For staffing decisions, higher sales volume typically indicates higher customer traffic, which requires more staff to handle checkouts, restocking, and customer service. However, it's important to note that high sales don't always mean high transaction counts; a few large purchases can skew this metric.
Day-of-Week Performance = Total sales grouped by day of week (Monday through Sunday), often calculated as a percentage of total weekly sales. This metric reveals behavioral patterns—do customers prefer shopping on weekends versus weekdays? The calculation is: (Sales on Day X / Total Weekly Sales) × 100. This percentage helps managers understand the relative importance of each day. For example, if Saturday represents 25% of weekly sales, it deserves 25% of weekly staff hours (adjusted for other factors like task complexity).
Transaction Count = The number of individual purchases or checkout events. This metric is distinct from sales volume because it focuses on customer traffic rather than spending. A day might have low sales volume but high transaction count if customers are buying fewer items per visit. For staffing purposes, transaction count often matters more than dollar volume because each transaction requires staff time at checkout, regardless of purchase size.
Average Transaction Value = Total Sales / Transaction Count. This metric reveals customer purchase behavior. A higher average transaction value might indicate customers doing weekly "stock-up" shopping, while lower values suggest quick convenience visits. Understanding this helps predict not just how many staff you need, but what kind of staffing mix (more cashiers vs. more floor associates for restocking).
Peak vs. Off-Peak Ratio = Comparison of sales between highest-performing and lowest-performing days. For example, if Saturday generates $15,000 and Tuesday generates $5,000, the ratio is 3:1. This helps quantify the magnitude of pattern differences and guides how dramatically staffing should flex throughout the week.
Business Logic and Trade-offs in Retail Staffing
When analyzing weekly sales patterns for staffing decisions, analysts must consider several important business rules and trade-offs. First, there's often a lag between sales patterns and operational needs—high sales volume doesn't just require checkout staff, it also means more restocking, more customer questions, and more cleaning. So staffing decisions can't be purely proportional to sales; you need baseline coverage even on slow days.
Second, labor regulations and employee preferences create constraints. You can't simply schedule everyone for Saturday and have minimal staff on Tuesday—employees need consistent hours, and many jurisdictions have minimum shift length requirements. Smart retailers identify their "core team" who work consistent schedules and supplement with flexible part-time staff during peak periods.
Third, not all days are created equal even if sales are similar. Monday morning might generate the same revenue as Wednesday evening, but Monday requires staff to recover from the weekend (restocking, cleaning, receiving shipments) while Wednesday is pure customer service. Context matters beyond raw numbers.
Finally, seasonal variations complicate weekly patterns. A "slow Tuesday" in January might still be busier than a "busy Saturday" in August if you're in a college town where students leave for summer. Analysts should be cautious about treating 6 months of data as representing eternal truth—patterns can shift with seasons, holidays, local events, and changing consumer behavior. The goal is to find patterns that are strong and consistent enough to act on while remaining alert to exceptions and changes.
ER Diagram
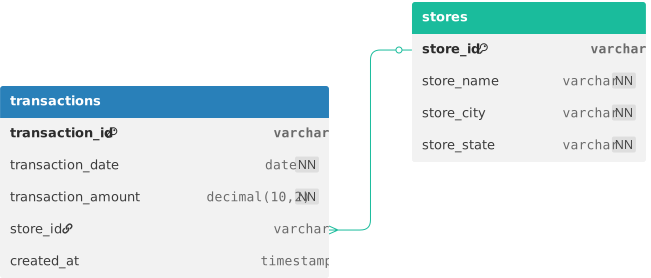
Loading the interactive workspace...