On Time or Late? Predicting Inbound Shipment Delays Using Logistic Regression
Your production line stops tomorrow — the shipment data knew three days ago.
Problem Statement
NexaFreight Logistics is a third-party logistics (3PL) provider managing inbound shipment operations for manufacturing clients across the United States. Over the past two and a half years, NexaFreight has processed tens of thousands of inbound shipments sourced from supplier origins across Asia-Pacific, Europe, North America, and Latin America, routed through multiple carriers and entry ports before reaching client warehouses.
The operations team has identified a persistent and expensive problem: inbound shipment delays are disrupting client production schedules at an unacceptable rate. In the 30-month period from June 2023 through December 2025, approximately 32% of all inbound shipments arrived later than their scheduled delivery window. Each delayed shipment triggers a cascade — expedited freight charges averaging $1,800 per incident, production buffer stock depletion, and contractual penalty clauses with clients. The total estimated cost of delays in 2024 alone exceeded $3.4 million across NexaFreight's client portfolio.
The core issue is reactive management: the operations team only learns a shipment will be late when it actually misses its window, leaving no time to pre-position inventory buffers or arrange alternative sourcing. The planning director has commissioned a predictive analytics project to change this. Using 25,000 historical inbound shipment records, your task is to engineer relevant delay-prediction features from shipment attributes, train a Logistic Regression classifier to predict whether an inbound shipment will be delayed (1) or on time (0), evaluate model performance using a Confusion Matrix, Precision, Recall, and F1-Score, and identify the most influential factors driving delay risk. The output will power an early-warning system that flags high-risk shipments up to five days before their scheduled arrival window — giving the operations team enough lead time to act.
Stakeholder Requirements
--Engineer at least 5 shipment-level features relevant to delay prediction (e.g., lead time buffer days, carrier reliability tier, origin region, shipment weight category, route distance band) and confirm through exploratory analysis that each feature shows a meaningful difference in delay rate between its categories before modelling begins.
--Train a Logistic Regression classifier using an 80/20 train/test split, generate predictions on the held-out test set, and produce a Confusion Matrix with the counts of true positives, true negatives, false positives, and false negatives — then calculate and report Precision, Recall, and F1-Score for the "Delayed" class.
--Interpret the model coefficients to identify the top 3 factors most strongly associated with shipment delay, and present a final risk summary table showing the predicted delay probability for each combination of carrier tier and origin region — giving the operations team a practical lookup guide for flagging high-risk shipment bookings.
Domain Understanding
Inbound Logistics & Delay Risk Overview
Inbound logistics refers to the movement of raw materials, components, and finished goods from suppliers and origin points into a company's receiving facilities. For third-party logistics providers like NexaFreight, managing inbound shipments means coordinating across multiple carriers (air freight, ocean freight, road, rail), multiple supplier origins spanning different regulatory environments and infrastructure quality levels, and multiple entry points (ports, border crossings, inland terminals). Shipment delays in this context are rarely caused by a single factor — they typically result from a combination of carrier reliability, route congestion, customs clearance efficiency, shipment characteristics (weight, volume, commodity type), and the amount of scheduling buffer built into the original booking. This multi-factor nature of delay risk is precisely why machine learning classifiers outperform simple rule-based flags: they can capture interactions between risk factors that no single threshold-based rule would catch. For example, a heavy shipment from a congested origin region via a Tier-2 carrier with minimal lead time buffer is significantly higher risk than any one of those factors in isolation.
Critical Metrics & Calculations
Five metrics define model performance and operational risk in this domain:
1. Delay Rate
Delay Rate = (Delayed Shipments / Total Shipments) × 100
The baseline KPI. If your model predicts "delayed" for every shipment, it would be correct 32% of the time — this is the "naïve baseline" your model must meaningfully exceed.
2. Precision (for Delayed class)
Precision = True Positives / (True Positives + False Positives)
Of all shipments your model flags as "will be delayed," what fraction actually were delayed? Low precision means too many false alarms — the operations team wastes resources investigating shipments that arrive on time.
3. Recall (for Delayed class)
Recall = True Positives / (True Positives + False Negatives)
Of all shipments that actually were delayed, what fraction did your model catch? Low recall means missed delays — the most costly outcome, since each missed alert is an unmitigated production disruption.
4. F1-Score
F1 = 2 × (Precision × Recall) / (Precision + Recall)
The harmonic mean of Precision and Recall. Used when both false positives and false negatives carry cost, but you need a single summary metric. For NexaFreight, Recall is slightly more important than Precision (missing a delay is worse than a false alarm), so an analyst might also report Recall separately alongside F1.
5. Lead Time Buffer
Buffer Days = Scheduled Delivery Date − Order Date − Standard Transit Days
How much scheduling cushion was built into the booking relative to the standard transit time for that route. A buffer of 0 or negative means the shipment was booked with no room for error — a strong predictor of delays materialising as missed windows even when transit is only slightly longer than expected.
Business Logic & Trade-offs
The most important trade-off in this model is between Precision and Recall, and the right balance depends on the operational cost structure. In NexaFreight's case, a false negative (predicting on-time, but the shipment is actually delayed) costs approximately $1,800 in expedited freight charges plus potential client penalties. A false positive (flagging a shipment as "at risk" when it arrives on time) costs the operations team roughly 30 minutes of investigation time and potential unnecessary buffer stock pre-positioning — perhaps $200–400 in loaded labour cost. Given this asymmetry, the business case favours optimising for Recall even at the cost of some Precision — it is better to over-alert than to miss a delay. This is a key analytical judgment the learner must articulate, not just calculate.
A second important constraint is class imbalance: with ~32% of shipments delayed and ~68% on-time, a naïve classifier that always predicts "on-time" achieves 68% accuracy — which sounds reasonable but has zero operational value. This is why reporting accuracy alone is insufficient and why Precision, Recall, and F1 on the minority (Delayed) class are the correct evaluation metrics. At Level 4, learners should understand this conceptually even if they don't apply SMOTE or class weighting — recognising the limitation is itself a professional skill.
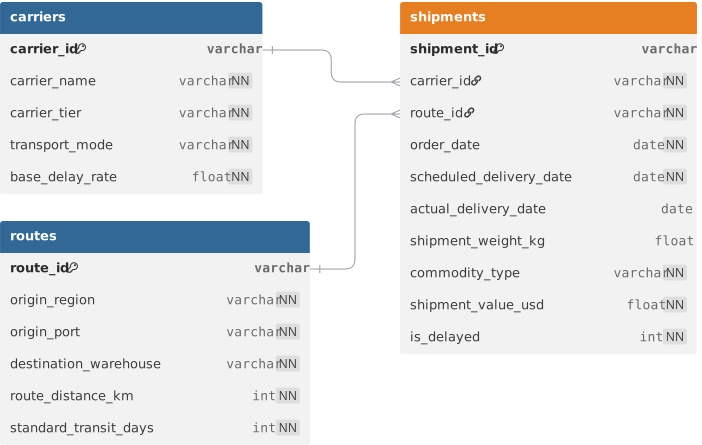
ER Diagram
Loading the interactive workspace...