Mortgage Default Risk Assessment Using a Rule-Based Credit Scorecard
Before the bank says yes — does the numbers say no?
Problem Statement
CreditSafe Bank is a retail bank offering home mortgage products across six Indian cities — Mumbai, Delhi, Bangalore, Hyderabad, Chennai, and Pune. Between January 2022 and December 2024, CreditSafe processed approximately 2,500–3,000 mortgage applications from individual borrowers seeking home loans ranging from ₹15 lakhs to ₹1.5 crore. The bank's historical default rate — borrowers who missed three or more consecutive EMI payments within 24 months of loan disbursement — has been hovering between 12–16%, well above the industry benchmark of 8–10% for comparable mid-sized retail lenders.
The Chief Risk Officer has flagged that the current loan approval process relies heavily on relationship manager judgment and incomplete credit checks, with no systematic, data-driven risk classification in place. Approvals are inconsistent across branches — the same applicant profile might be approved in one branch and rejected in another. The bank needs a standardised, transparent, and repeatable risk assessment framework that any branch officer can apply to incoming applications. You have been engaged as a data analyst to build CreditSafe's first mortgage credit scorecard using the bank's application data. Your task is to compute three core financial risk ratios for each applicant, combine them into a simple composite scorecard, and classify every applicant into one of three risk tiers: Low Risk, Medium Risk, or High Risk. The output will serve as the baseline framework for CreditSafe's Q1 2025 lending policy review.
Stakeholder Requirements
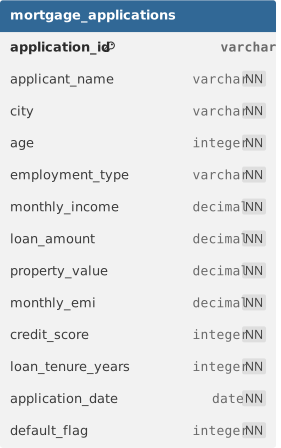
--Scorecard Construction: For each mortgage application, compute three financial risk indicators: Debt-to-Income Ratio (DTI) = monthly EMI divided by monthly income; Loan-to-Value Ratio (LTV) = loan amount divided by property value; and Credit Score Band mapped from the applicant's raw credit score (300–900 scale) into three bands: Poor (300–579), Fair (580–719), Good (720–900). Assign a risk point of 1 (low risk), 2 (medium risk), or 3 (high risk) to each indicator based on defined thresholds. Sum the three points into a Composite Risk Score (range 3–9).
--Risk Tier Classification & Summary: Classify each applicant into Low Risk (score 3–4), Medium Risk (score 5–6), or High Risk (score 7–9) based on their Composite Risk Score. Report the count and percentage of applicants in each tier. Then calculate the actual default rate within each risk tier (percentage of applicants in that tier who defaulted) to validate that the scorecard correctly separates high-risk from low-risk borrowers.
Domain Understanding
Mortgage Credit Risk in Retail Banking
Mortgage lending is one of the highest-stakes decisions a retail bank makes. Unlike a personal loan or a credit card — which are relatively small and short-term — a home loan is typically the largest financial commitment a borrower takes on, often spanning 15–30 years, and for the bank it represents a significant concentration of credit risk on its balance sheet. Default on a mortgage doesn't just mean missed payments — it triggers a cascade of regulatory provisions, collateral recovery proceedings, and potential reputational risk for the lender. Credit scorecards are the industry's primary tool for standardising this risk assessment. They translate complex financial profiles into a single, interpretable score that branch officers, credit committees, and automated decision systems can act on consistently. Rule-based scorecards — like the one built in this case study — are the foundational layer of every credit risk function in retail banking, and understanding how to build one is a core skill for any analyst entering the finance domain.
Critical Metrics & Calculations
Three ratios are the backbone of any mortgage credit scorecard:
-
Debt-to-Income Ratio (DTI): Measures the proportion of a borrower's monthly income that will be consumed by the loan repayment. Formula:
DTI = Monthly EMI / Monthly Income. A DTI below 30% is generally considered comfortable; 30–50% is borderline; above 50% signals that the borrower may struggle to service the debt alongside other living expenses. Lenders in India typically cap mortgage DTI at 50–55%. -
Loan-to-Value Ratio (LTV): Measures how much of the property's value is being financed by the bank versus covered by the borrower's own down payment. Formula:
LTV = Loan Amount / Property Value. A lower LTV means the borrower has more "skin in the game" and the bank has more collateral cushion if it needs to recover the loan through property sale. RBI guidelines cap LTV at 90% for loans up to ₹30 lakhs, and 75–80% for higher loan amounts. -
Credit Score Band: Raw credit scores (on a 300–900 scale, as used by CIBIL in India) are grouped into meaningful bands. Good (720–900): strong repayment history, low risk. Fair (580–719): moderate history, some missed payments. Poor (300–579): significant derogatory marks, high default probability. Each band maps directly to a risk point in the scorecard.
-
Composite Risk Score: The sum of individual risk points assigned to DTI, LTV, and Credit Score Band. Formula:
Score = DTI_points + LTV_points + CreditBand_points. Range: 3 (all low risk) to 9 (all high risk). Segment thresholds: Low Risk = 3–4, Medium Risk = 5–6, High Risk = 7–9.
Business Logic & Trade-offs
One important feature of rule-based scorecards is their transparency — every score can be fully explained to the applicant, the branch officer, and the regulator by pointing to the exact thresholds that drove each component. This is a significant advantage over machine learning models in a regulated industry like banking, where explainability is not optional. A key trade-off in scorecard design is threshold calibration: setting DTI cutoffs too conservatively will reject many creditworthy applicants (false positives), reducing loan book growth. Setting them too loosely will approve risky applicants (false negatives), increasing the default rate. The "right" thresholds depend on the bank's risk appetite and are typically calibrated against historical default data — which is exactly what the scorecard validation step in this case study does. Another practical nuance: the three scorecard components are not equally predictive. Credit score history is typically the strongest predictor of default, followed by DTI, then LTV. A more sophisticated scorecard would apply weighted points to reflect this — but for a Level-2 analysis, equal weighting is the right starting point.
ER Diagram
Loading the interactive workspace...