Maximize Campaign ROI: Personal Loan Propensity Modelling
Who will say yes before you even make the call?
Problem Statement
Crestline Bank is a regional financial institution serving customers across the southern United States, offering personal banking products including checking accounts, savings accounts, credit cards, and money market accounts. In the third quarter of 2024, the retail banking division launched a pilot personal loan campaign, reaching out to 800 of its existing customers with a targeted offer — a personal loan ranging from $15,000 to $50,000 at competitive interest rates between 8.5% and 10.5%. Response data from the pilot has been collected and recorded, showing that approximately 27% of contacted customers accepted the offer. The remaining 500 customers in the bank's active base were not included in the pilot and have yet to be contacted.
The campaign team does not have the budget to contact all 500 remaining customers with the same intensity — phone outreach, personalised mailers, and relationship manager time are costly. Instead, they want to use the pilot response data to build a propensity model: a scored ranking of the remaining customers from most to least likely to accept a personal loan offer. You have been brought in as the bank's analytics consultant to build this model using the pilot data, evaluate its predictive performance, and deliver a prioritised outreach list for the next campaign wave. Your analysis must include feature engineering from transaction and account data, handle a set of data quality issues in the pilot dataset, apply target encoding to a high-cardinality categorical variable, train and evaluate a Logistic Regression model, and ultimately score and rank the 500 non-pilot customers by their estimated likelihood to accept.
Stakeholder Requirements
--Build and evaluate a Logistic Regression propensity model using the pilot loan offer data as training and test sets. Report ROC-AUC, precision, recall, and the confusion matrix on the held-out test set. Interpret the model coefficients to explain which customer features are the strongest drivers of loan acceptance.
--Apply target encoding to the occupation feature before modelling. Document why target encoding was chosen over one-hot encoding for this use case, demonstrate the correct approach for avoiding target leakage (encoding fit on training data only), and show the resulting encoding map by occupation category.
--Score and rank all 500 non-pilot customers using the trained model. Segment them into propensity tiers (Low / Medium / High / Very High) and produce a prioritised outreach list of the top 100 customers with their key profile attributes. Provide a brief strategic recommendation for each tier.
Domain Understanding
Propensity Modeling in Retail Banking
Propensity modeling is one of the most commercially impactful applications of machine learning in retail banking. Rather than blasting all customers with the same offer and hoping for the best, banks use propensity models to rank customers by their estimated likelihood of responding positively to a specific product offer — a personal loan, a credit card upgrade, a fixed deposit, or a mortgage. The model is trained on historical campaign response data (who was offered, who accepted) and the features that describe each customer at the time of the offer: demographics, relationship depth (how many products they hold), balance levels, and transaction behavior. This allows the marketing and lending teams to concentrate their outreach budget on the highest-probability customers, improving conversion rates and reducing cost-per-acquisition significantly. In practice, a propensity model that correctly identifies the top 20% of customers — who might account for 60%+ of acceptances — can cut campaign costs by 50% while maintaining or improving total conversions. This is the core commercial value proposition: do more with less by targeting smarter.
Critical Metrics and Calculations
The following metrics are central to building, evaluating, and deploying a propensity model in a banking context:
ROC-AUC (Area Under the Receiver Operating Characteristic Curve) — The primary evaluation metric for binary classification models with imbalanced or commercially sensitive outcomes. A value of 0.5 is equivalent to random chance; 0.7–0.75 is considered acceptable for first-generation propensity models on small datasets; 0.80+ is good. ROC-AUC measures the model's ability to rank positive cases (acceptors) higher than negative cases (decliners) across all possible classification thresholds.
Precision and Recall — Two competing metrics that must be balanced based on business priorities. Precision = TP / (TP + FP) measures "of everyone we predicted as an acceptor, what fraction actually accepted?" Recall = TP / (TP + FN) measures "of everyone who actually accepted, what fraction did we correctly identify?" In campaign optimisation, recall matters most — missing a likely acceptor is costly.
Target Encoding — A feature encoding method where a categorical variable's values are replaced with the mean of the target variable (accepted = 1/0) for that category, calculated from training data only. Encoded Value = mean(target | category = c). It captures predictive signal efficiently without dimensionality explosion, but requires careful handling to avoid target leakage.
Propensity Score = P(accepted = 1 | features) — The output of model.predict_proba()[:, 1] for a LogisticRegression fitted to the pilot data. This probability score is used to rank all non-pilot customers for outreach prioritization.
Lift = (Acceptance rate in top-K% scored) / (Overall acceptance rate) — Measures how much better the model performs versus random targeting. A lift of 2.0 at the top decile means the top 10% of scored customers accept at 2× the base rate.
Business Logic and Trade-offs
One of the most important practical decisions in propensity modeling is the choice of training data and how to define the "positive class." In this case study, accepted = 1 in loan_offers is straightforwardly defined. However, in production banking systems, this is often messier — some customers never respond (non-response is different from rejection), some accept but later cancel before disbursement, and some are excluded from campaigns for regulatory or risk reasons. Always clarify with the business what the positive class represents before modeling. A second critical trade-off is between model complexity and interpretability. Logistic Regression is preferred in many banking contexts because regulators (particularly in the US under ECOA and fair lending laws) require that credit decisions can be explained — a black-box gradient boosting model is harder to defend in a regulatory audit. Finally, the train/test split must use temporal logic when possible: train on earlier campaign waves, test on later ones. Randomly splitting a single campaign wave (as done here for simplicity at Level 4) is acceptable for learning purposes but can overestimate real-world performance due to within-campaign correlations.
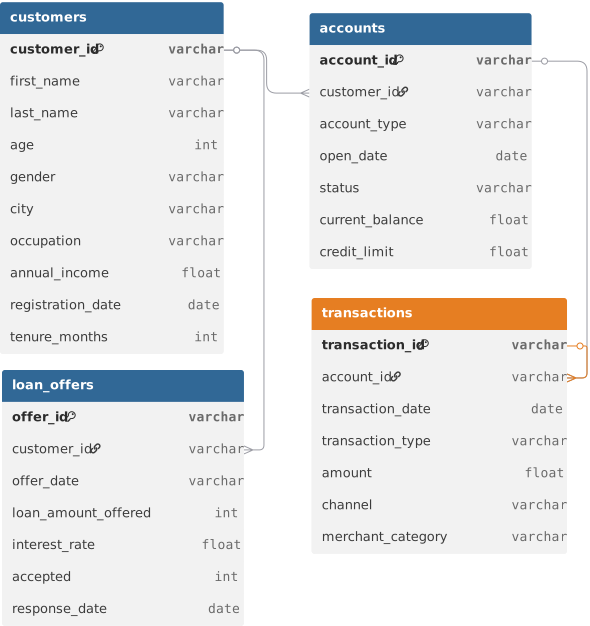
ER Diagram
Loading the interactive workspace...