Know Your Customers: RFM-Based Customer Segmentation Using K-Means Clustering
Who are your best customers — and are you ignoring them?
Problem Statement
ShopNest Retail Co. is a growing mid-size retail chain operating 12 stores across Texas, with an e-commerce arm launched in early 2021. Over the 18 months spanning January 2022 through June 2023, ShopNest recorded over 14,000 customer transactions across five product categories — Electronics, Apparel, Home & Kitchen, Beauty, and Sports & Outdoors. With a customer base of approximately 2,000 unique shoppers and $1.4M in total revenue over this period, the business is scaling at pace. But the marketing team hasn't kept up.
Here's the problem: every customer receives the same promotional email. The loyal shopper who buys every two weeks gets the same generic 10% discount code as the customer who bought once and never returned. The result is a rising email unsubscribe rate, a promotional budget that isn't being spent strategically, and a growing concern from the VP of Marketing, Sarah Chen, that "we're leaving money on the table by not knowing who our customers actually are."
Sarah has commissioned you as the data analyst to solve this. Your task is to build an RFM profile for every customer — measuring how Recently they purchased, how Frequently they buy, and how much Money they spend — and then use K-Means Clustering to group customers into distinct behavioral segments. This is a descriptive and diagnostic analysis: you are not predicting future behavior, but revealing the hidden structure already present in the transaction data. The final output will directly power ShopNest's next campaign strategy, enabling Sarah's team to send the right message to the right customers for the first time.
Stakeholder Requirements
--Segment all 2,000 ShopNest customers into distinct behavioral groups using K-Means clustering on their RFM features. Use the Elbow Method to justify your choice of k, and assign each cluster a clear, business-friendly label (e.g., "Champions," "Loyal Customers," "At-Risk," "Occasional Buyers").
--Produce a final summary table showing each segment's name, customer count, average Recency (days since last purchase), average Frequency (number of transactions), and average Monetary value (total spend) — so Sarah's team can immediately understand each group's profile and plan campaign messaging accordingly.
Domain Understanding
The Retail Industry
Retail is a transaction-dense industry where customer relationships are built (or lost) one purchase at a time. Unlike subscription businesses where engagement is contractual, retail customers are entirely voluntary — they return because they find value, and they disappear without notice when they don't. This makes customer behavior analysis not just useful, but essential for survival. The key business process relevant to this case study is the purchase transaction cycle: a customer visits (in-store or online), selects products, completes payment, and either returns or doesn't. The pattern of these events — when, how often, and for how much — contains the signal we're mining. The most common challenge practitioners face in retail analytics is that raw transaction data tells you what happened but not what it means about the customer. Segmentation is the bridge between raw data and actionable strategy.
Critical Metrics & Calculations
RFM stands for Recency, Frequency, and Monetary — three dimensions that together paint a surprisingly complete picture of customer value.
-
Recency =
Reference Date − MAX(transaction_date)per customer, expressed in days. Lower is better — a customer who bought yesterday is more engaged than one who bought six months ago. It signals whether a customer is still active in their relationship with the brand. -
Frequency =
COUNT(transaction_id)per customer. Higher frequency signals loyalty and habit. A customer who has made 15 purchases in 18 months is far more habitual than one who has made 2, regardless of spend. -
Monetary =
SUM(total_amount)per customer. Higher monetary value means higher direct revenue contribution. It captures lifetime value within the analysis window.
Importantly, these three metrics are not equally correlated — a customer can be high-frequency but low-monetary (many small purchases), or low-frequency but high-monetary (rare but large purchases). That's precisely why clustering on all three simultaneously is more powerful than ranking on any one alone.
Business Logic & Trade-offs
The key business insight behind RFM segmentation is that different customer types require fundamentally different marketing approaches — and using the wrong approach can actually hurt. Sending aggressive discount codes to your Champions (who buy without discounts) trains them to wait for sales, eroding margin. Ignoring At-Risk customers (who used to buy but have gone quiet) means losing revenue that is still recoverable with the right re-engagement message. For K-Means specifically, there is one important trade-off to understand: the algorithm requires you to pre-specify the number of clusters (k). Too few clusters lose the nuance between customer types; too many produce segments too small and similar to act on meaningfully. The Elbow Method helps resolve this by plotting inertia (within-cluster sum of squared distances) against k — you look for the point where adding another cluster stops providing meaningful compression. For retail RFM data, k=3 to 5 typically captures the most actionable structure. Additionally, because Monetary values are in hundreds of dollars while Recency and Frequency are single or double digit numbers, feature scaling is mandatory before running K-Means — otherwise the algorithm will be dominated by the largest-valued feature regardless of its actual business importance.
ER Diagram
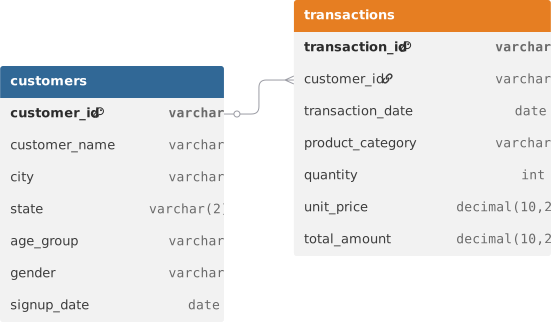
Loading the interactive workspace...