Know Your Buyers: RFM-Based Customer Segmentation with K-Means Clustering
Not all customers are equal — are you treating them that way?
Problem Statement
Cartly is a fast-growing direct-to-consumer e-commerce brand selling home goods, kitchenware, and lifestyle accessories online. Founded in 2020 and operating exclusively through its own website, Cartly has grown its registered customer base to over 1,200 buyers and processed roughly 17,000 orders since January 2023. The brand competes in a crowded market by emphasizing quality, fast shipping, and a curated product selection across five categories: Kitchen, Home Decor, Lighting, Storage, and Bedding. Despite healthy overall revenue growth, the marketing team has observed that engagement rates on email campaigns have been declining. Promotions that once reliably drove repurchase are generating diminishing returns. The root cause, suspected by the head of marketing, is that all customers are receiving identical messaging regardless of their purchase history, loyalty, or level of engagement.
You have been brought in as a junior data scientist to build Cartly's first customer segmentation model. Using order history from January 2023 through December 2025, you will compute three customer-level behavioral metrics — Recency (how recently they bought), Frequency (how often they buy), and Monetary value (how much they spend in total) — and use K-Means clustering to group customers into meaningful segments. Your job is to identify how many natural customer groups exist in the data using the Elbow Method, apply K-Means to assign every customer to a segment, give each segment a business-meaningful name, and summarize what makes each group distinct
Stakeholder Requirements
-- Use the Elbow Method to determine the optimal number of customer segments (k), then apply K-Means clustering to assign every customer to a segment — present a clear elbow curve chart and state which value of k you selected and why.
-- Build a segment profile table showing the average Recency, Frequency, and Monetary value for each cluster, assign a business-meaningful label to each segment (e.g., "Champions," "At-Risk"), and visualize the segments using a scatter plot of any two RFM dimensions colored by cluster.
Domain Understanding
E-commerce is defined by its scale and speed — thousands of customers transacting across hundreds of SKUs, with every click and purchase recorded. Unlike physical retail, e-commerce businesses have near-perfect visibility into individual customer behavior: what was bought, when, how often, and for how much. This data richness is a competitive advantage, but only if it's acted upon. The core challenge for e-commerce marketers is personalization at scale — delivering the right message to the right customer at the right time. Customer segmentation is the foundational step that makes this possible. Without segmentation, a brand is essentially shouting the same message to thousands of people with wildly different levels of engagement, loyalty, and value. With segmentation, the same marketing budget can be redirected toward behaviors that actually drive ROI: retaining top buyers, re-engaging at-risk customers, and accepting that some customers have already left.
Critical Metrics and Calculations
The RFM framework is the most widely used customer analytics approach in e-commerce, retail, and subscription businesses. It captures three dimensions of customer behavior:
Recency (R) = Number of days between the customer's most recent order and a fixed observation date (the "snapshot date"). Formula: recency = (snapshot_date - last_order_date).days. Lower recency is better — it means the customer bought recently. A customer with recency = 10 is far more engaged than one with recency = 400.
Frequency (F) = Total number of distinct orders placed by the customer within the observation window. Formula: frequency = COUNT(DISTINCT order_id) WHERE customer_id = X. Higher frequency indicates stronger loyalty. First-time buyers (frequency = 1) behave very differently from repeat customers (frequency ≥ 5).
Monetary Value (M) = Total amount spent by the customer across all orders in the observation window. Formula: monetary = SUM(order_total) WHERE customer_id = X. High-monetary customers represent disproportionate revenue contribution — in most e-commerce businesses, the top 20% of customers generate 60–80% of revenue (Pareto principle).
Average Order Value (AOV) = monetary / frequency. Useful for distinguishing customers who buy frequently in small amounts from those who buy rarely but spend a lot per order. These require very different marketing strategies.
Business Logic and Trade-offs
The most important design decision in an RFM segmentation is the snapshot date — the reference point for computing recency. For a historical analysis, this is typically set to the last date in your dataset (or the last day of the most recent full month). All recency values are calculated relative to this fixed point, ensuring consistency across customers. A common mistake is to use today's date, which shifts recency values every time the analysis runs and makes historical comparisons unstable.
K-Means clustering requires all features to be on comparable scales. RFM values are naturally on very different scales — recency might range from 0 to 900 days, frequency from 1 to 50 orders, and monetary from $20 to $5,000. Without scaling, the monetary feature would dominate the clustering purely because its numbers are larger, not because it's more important. StandardScaler (zero mean, unit variance) or MinMaxScaler (range 0–1) must be applied before fitting K-Means. A key business trade-off is the number of clusters: too few clusters (k=2) gives broad, less actionable segments; too many (k=8) gives over-granular groups that are hard to act on. For most e-commerce businesses, 3–5 segments is the practical sweet spot, which is why the Elbow Method result typically lands in this range.
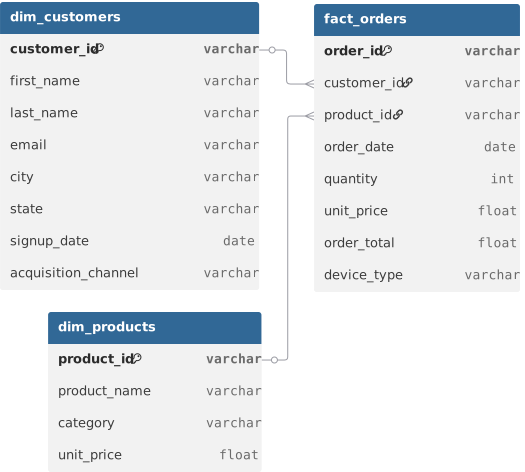
ER Diagram
Loading the interactive workspace...