Group to Grow: Store Network Segmentation Using K-Means Clustering
25 stores, one budget — which ones actually behave the same?
Problem Statement
PeakMart Retail Group is a mid-size general merchandise retailer operating 25 stores across four US regions — North, South, East, and West. Over the past two years (2024–2025), the company has processed over 9,000 customer transactions and grown its network steadily. But as the Head of Retail Strategy reviews the annual performance reports, a troubling pattern emerges: a handful of stores are consistently generating premium revenue, some are churning through high transaction volumes at thin margins, and a cluster of five Western outlets are struggling with low foot traffic and unusually high return rates — all while receiving roughly equal operational investment.
The problem isn't that PeakMart lacks data. It's that leadership is treating all 25 stores as if they operate the same way. Budget allocations, promotional campaigns, staffing models, and product assortment decisions are being applied uniformly — a one-size-fits-all approach that inadvertently penalizes high performers and fails to triage underperformers. The VP of Retail Operations wants to move to a segment-based management model, but needs an objective, data-driven foundation to define what those segments actually are.
You have been brought in as a data analyst to apply K-Means clustering to PeakMart's store performance data. Your task is to aggregate transaction-level data into store-level behavioral profiles, identify natural groupings, and give each cluster a meaningful business label. The analysis is purely descriptive and diagnostic — the goal is to answer: "Which stores are genuinely similar to each other, and what does that similarity tell us about how to manage them differently?" The final deliverable is a cluster assignment for each store with clear, actionable interpretations that the retail strategy team can act on immediately.
Stakeholder Requirements
--Segment all 25 PeakMart stores into distinct performance clusters using K-Means, using the elbow method and silhouette score to justify your choice of k. Each store must receive a cluster assignment.
--For each identified cluster, write a 2-sentence business interpretation (what defines this group) and one concrete action the retail strategy team should take based on that cluster's profile.
Domain Understanding
Retail Network Operations
Running a retail store network is fundamentally a portfolio management problem. No two stores are identical — they differ in location demographics, foot traffic patterns, store size, competitive landscape, and customer mix. What makes this domain analytically interesting is that aggregate revenue figures mask enormous variation in how revenue is being generated. A store doing $500K annually through 10,000 low-value transactions is structurally very different from one doing the same revenue through 4,000 premium transactions — even though the top-line number looks identical. Retail practitioners regularly segment their networks to make better decisions about inventory assortment, pricing strategy, staffing models, and marketing spend. The core challenge is defining these segments objectively rather than relying on anecdote or seniority.
Critical Metrics and Calculations
The three metrics that anchor this analysis are foundational in retail analytics.
Average Transaction Value (ATV)
ATV = Total Revenue ÷ Number of Transactions
ATV tells you the average amount a customer spends per visit — a high ATV suggests premium product affinity or effective upselling, while low ATV suggests price-sensitive shoppers or a bargain-focused assortment.
Transaction Frequency
Frequency = Total number of completed sale transactions over a period
Frequency captures store footfall and customer engagement — a busy store isn't always a profitable one, but consistently low frequency is an early warning sign.
Return Rate
Return Rate = Number of Returned Transactions ÷ Total Transactions
Return rates above 10–12% in general merchandise retail are a red flag — they suggest product quality issues, misaligned customer expectations, poor sizing or description accuracy, or staff that oversells.
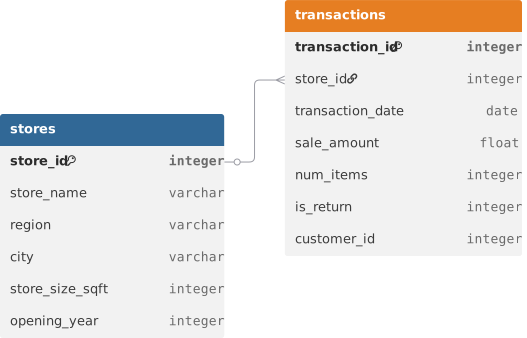
Together, these three metrics form a 3D behavioral fingerprint for each store. Before you can cluster, each metric needs to be computed by aggregating raw transactions up to the store level.
Business Logic and Trade-offs
A key business truth in retail clustering is that "performance" is multi-dimensional — there is no single axis from bad to good. A high-volume, low-ATV store is not strictly worse than a low-volume, high-ATV store; they may serve different customer needs and require different strategies. The trade-off analysts must always hold in mind is: are we identifying clusters to rank stores, or to understand them? In this case it is the latter.
K-Means is a distance-based algorithm, which means features with larger numeric ranges will dominate the clustering unless they are scaled first — a store with 500 transactions vs. one with 150 will look very different on that dimension, but the raw gap of 350 transactions would mathematically swamp a return rate difference of 0.08 (8%) even though the return rate difference is arguably more strategically significant. This is why StandardScaler is applied before fitting K-Means: it puts all features on equal footing. PCA is not used for analysis here — only for 2D visualization, since humans cannot intuitively interpret points in 3D feature space.
ER Diagram
Loading the interactive workspace...